


Litecoin Price Forecast: Bearish sentiment builds as correction looms below $50



- Litecoin trades in the red on Thursday, facing resistance around the key level.
- Derivatives data supports a bearish sentiment with falling open interest alongside rising short bets.
- The technical outlook suggests a correction ahead, targeting levels below $50.
Litecoin (LTC) is trading in the red, slipping below $58 at the time of writing on Thursday, and faces rejection at a key level. Weakening derivatives metrics support a bearish sentiment, while technical analysis suggests a deeper correction in the near term.
Fading investor participation
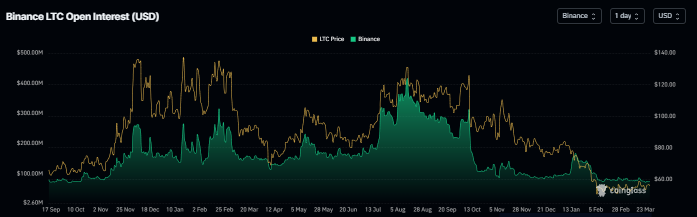
Litecoin’s futures Open Interest (OI) at Binance exchange dropped to $74.69 million on Thursday and has been continuously falling since mid-January. This drop in OI reflects waning investor participation and projects a bearish outlook.
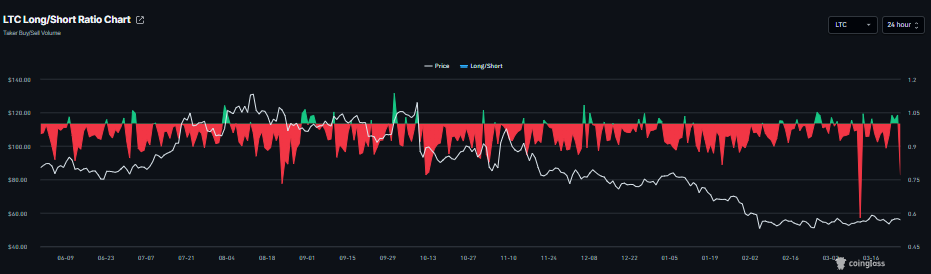
In addition, CoinGlass’s LTC long-to-short ratio, currently at 0.76 on Thursday, is near its lowest level in over a month. This ratio, below one, reflects bearish sentiment in the markets, as more traders are betting on the asset price to fall.
Litecoin Price Forecast: LTC momentum indicators show early signs of weakness
Litecoin is trading below $58 at the time of writing on Thursday. The near‑term bias is mildly bearish, as the price is being rejected near the 50-day EMA at $57.50.
The Relative Strength Index (RSI) on the daily chart is near the midline at 50 and pointing downward, indicating fading bullish strength. The Moving Average Convergence Divergence (MACD) line stays above the signal line and just above the zero mark, and the positive histogram, although modest, suggests fading bullish pressure.
Initial resistance lies at the nearby 50-day EMA at $57.80, with a horizontal barrier around $58.49 as the next upside level if buyers regain control.
On the downside, immediate support emerges at the 23.6% retracement near $54.47, protecting the lower zone ahead of the more distant horizontal support at $50.54. A daily close above $58.49 would strengthen the bullish bias toward $60.28, while a drop through $54.47 would expose $50.54 and suggest deeper weakness toward the February 6 low of $45.07.
-1774501808499-1774501808500.png)
(The technical analysis of this story was written with the help of an AI tool.)
Recommended Articles







Comments (0)
Click the $ button, enter the symbol, and select to link a stock, ETF, or other ticker.