


Solana Price Forecast: SOL deepens correction with downside risk toward $67.50



- Solana price is nearing the lower consolidation range at $76.45 on Monday, a breakdown suggests further correction.
- Derivatives data supports a bearish outlook with SOL’s short bets rising alongside negative funding rates.
- The technical outlook suggests SOL could revisit the February 6 low of $67.50.
Solana (SOL) price slips 6%, nearing the lower end of its consolidation range at $76.45 at the time of writing on Monday. A firm close below this level suggests a deeper correction. The derivatives data supports a bearish sentiment with SOL’s short bets rising alongside negative funding rates. On the technical side, if downside momentum continues, SOL may revisit its February 6 low around $67.50.
Solana’s derivatives data shows bearish bias
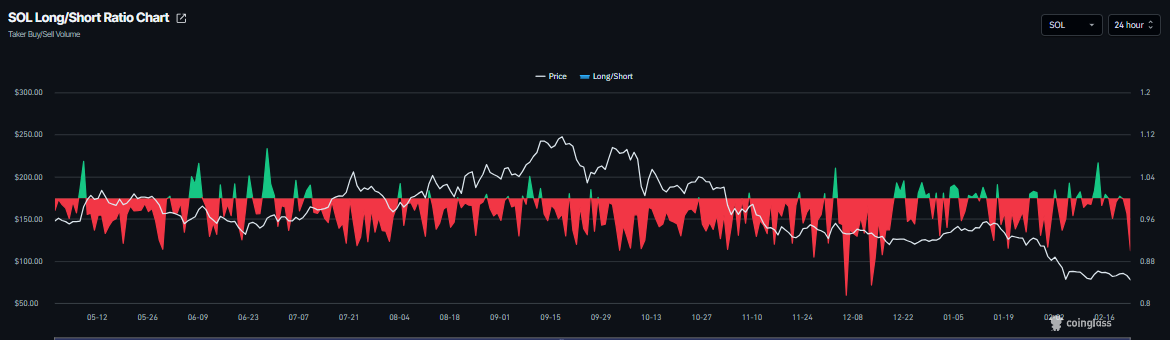
Solana’s long-to-short ratio reads 0.89 on Monday, nearing the lowest level over a month, according to CoinGlass data. This ratio below 1 indicates bearish sentiment as traders are betting on the asset price to fall.
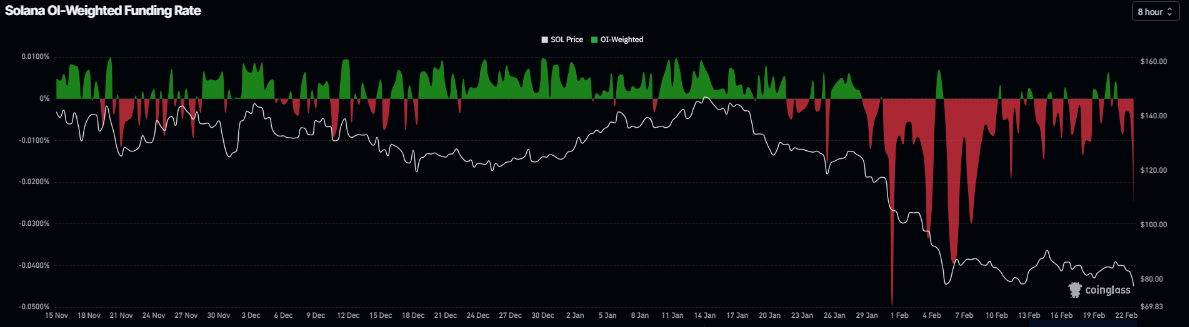
In addition, the funding rates for SOL also support a bearish outlook. CoinGlass data shows SOL’s funding rate flipped negative on Saturday and currently stands at -0.0245% on Monday, nearing the level seen during the February 6 price dip. This negative rate indicates that short positions are paying long positions and hints at bearish sentiment.
Solana Price Forecast: SOL could extend further losses if it closes below the support zone
Solana’s price corrected nearly 4% in the previous week, extending its six consecutive weeks of losses since mid-January. Solana price started the week on a negative note, trading 6% down, nearing the lower consolidation boundary at $76.45.
If SOL closes below the lower consolidation boundary at $76.45 on a daily basis, it could extend further losses toward the February 6 low at $67.50.
The Relative Strength Index (RSI) reads 31, pointing downward toward the oversold conditions, indicating bearish momentum gaining traction. The Moving Average Convergence Divergence (MACD) lines are converging, indicating indecisiveness among traders.
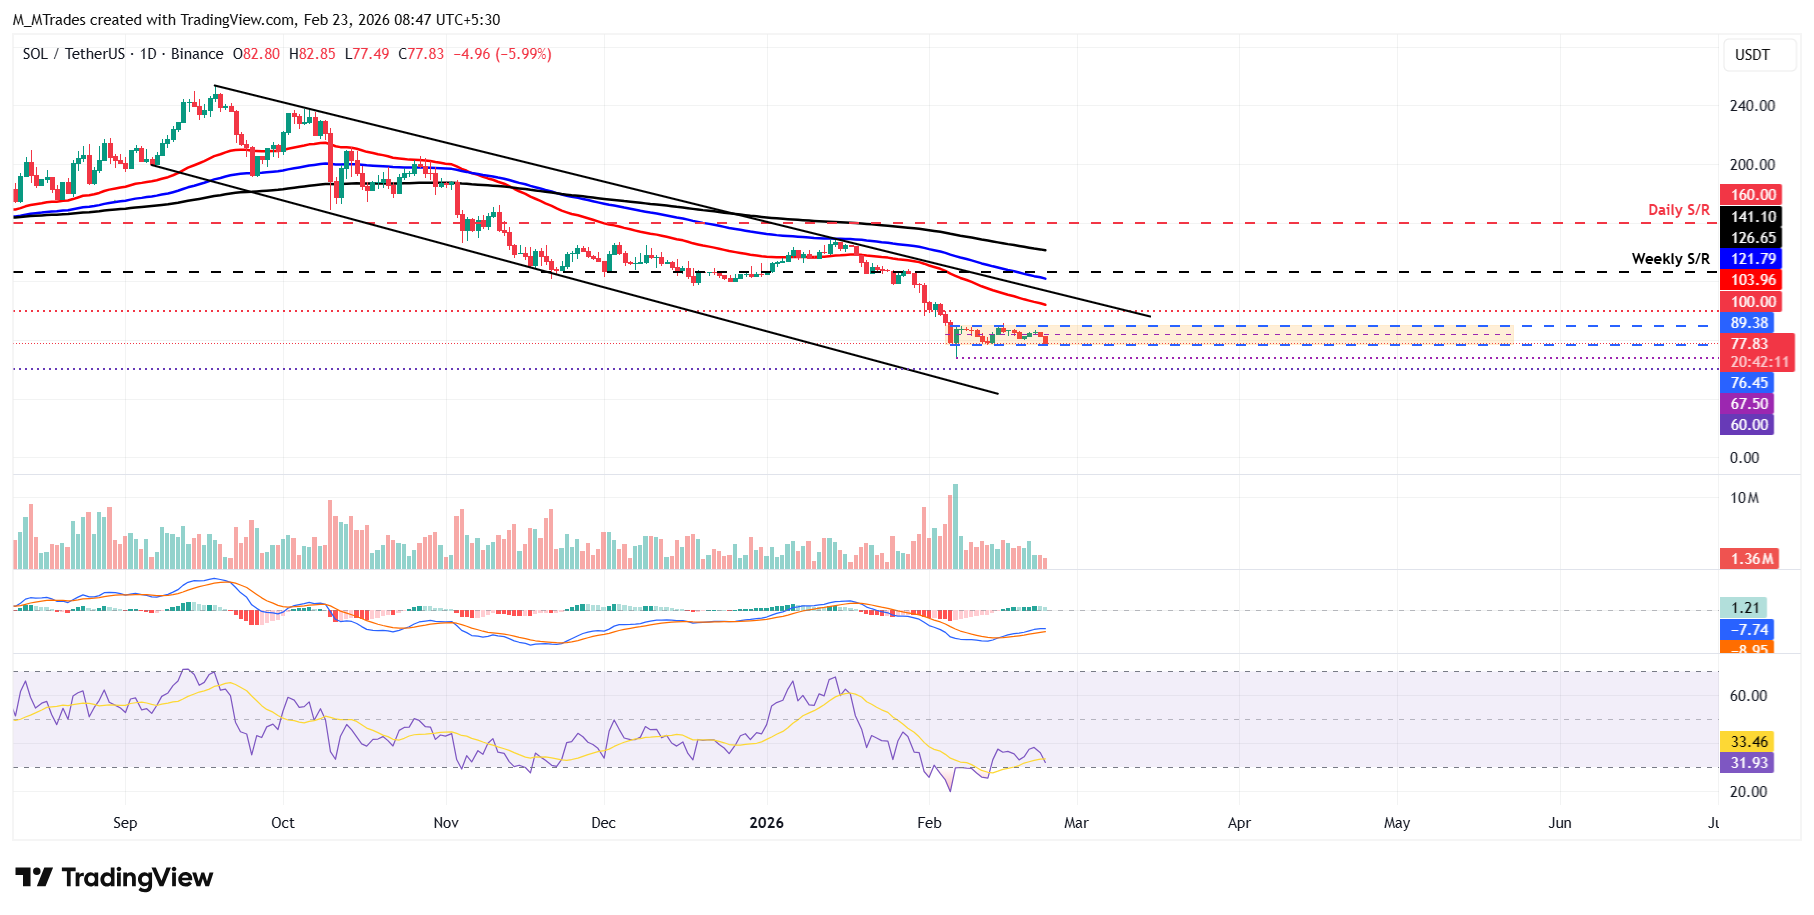
However, if the lower consolidation boundary at $76.45 holds as support, it could extend the recovery toward the upper consolidation zone at $89.38.
Recommended Articles









Comments (0)
Click the $ button, enter the symbol, and select to link a stock, ETF, or other ticker.