


Shiba Inu Price Forecast: SHIB extends losses as whale selling intensifies bearish momentum



- Shiba Inu price extends correction on Thursday, building on losses from the previous day.
- On-chain and derivatives data show bearish bias as whales offloading SHIB tokens and Open Interest is declining.
- The technical outlook suggests further downside, with momentum indicators showing bearish strength.
Shiba Inu (SHIB) price slips below $0.0000077 on Thursday after correcting the previous day. Bearish sentiment is further strengthened as holders offload SHIB, increasing selling pressure and reducing Open Interest (OI) in the derivatives market. On the technical side, weakening momentum suggests the downside pressure on the meme coin will continue.
Shiba Inu whales offload 32.17 billion tokens
Santiment’s Supply Distribution indicates that the number of Shiba Inu’s large-wallet holders is declining, suggesting a bearish outlook.
The metric indicates that the whales holding between 100,000 and 1 million (red line), 1 million and 10 million (yellow line), and 10 million and 100 million (blue line) have shed a total of 32.17 billion SHIB tokens from January 20 to Thursday, thereby increasing selling pressure.
 [11-1769671707461-1769671707474.48.49, 29 Jan, 2026].png)
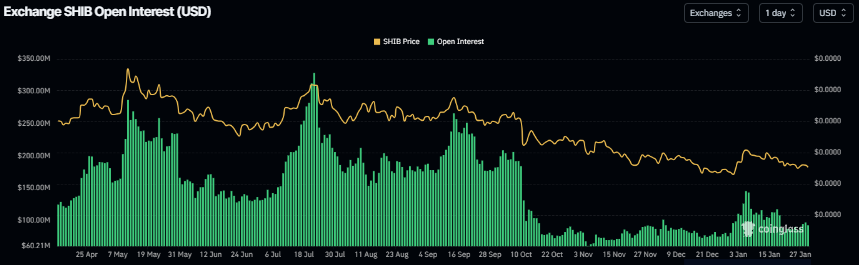
On the derivatives side, SHIB’s futures Open Interest (OI) dropped to $92.69 million on Thursday and has been steadily falling since the January 6 high of $145.56 million. This drop in OI reflects waning investor participation and projects a bearish outlook.
Shiba Inu Price Forecast: Bears are in control of the momentum
Shiba Inu price was rejected at the 50% price retracement level (from the October 6 high of $0.0000130 to the October 10 low of $0.0000067) at $0.0000099 on January 5 and has since been in a downward trend, correcting by over 18% through Sunday. SHIB started the week on a positive note, recovering 4.26% by Tuesday, but failed to sustain the recovery and declined slightly the next day. At the time of writing on Thursday, SHIB is trading down at $0.0000075.
If SHIB continues its downward trend, it could extend the decline toward Sunday’s low of $0.0000073. A close below could extend the further losses toward the October 10 low of $0.0000067.
The Relative Strength Index (RSI) on the daily chart reads 41, below the neutral level of 50, and pointing downward, indicating bearish momentum gaining traction. Moreover, the Moving Average Convergence Divergence (MACD) indicator showed a bearish crossover on January 17, which remains intact with rising red histogram bars below the neutral level, further supporting the negative outlook.
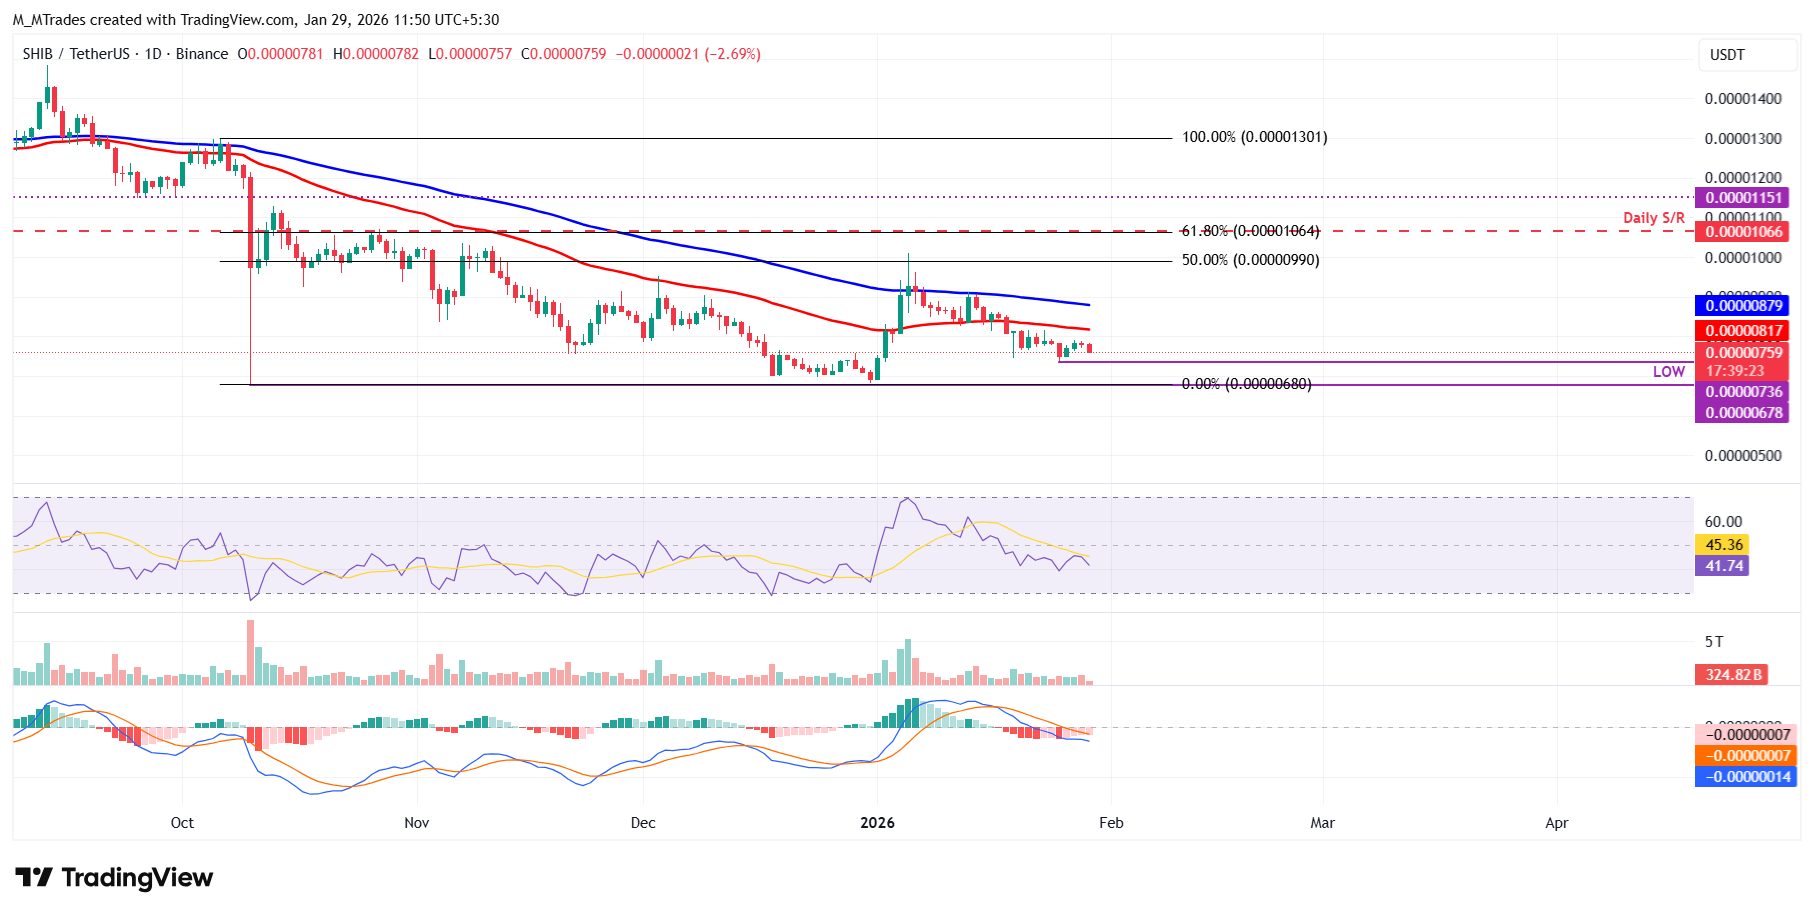
On the other hand, if SHIB recovers, it could extend the advance toward the 50-day Exponential Moving Average (EMA) at $0.0000081.
Recommended Articles










Comments (0)
Click the $ button, enter the symbol, and select to link a stock, ETF, or other ticker.