


Litecoin Price Forecast: LTC fee collection hits 7-month high as bullish momentum builds



- Litecoin price consolidates within a falling wedge pattern, with a breakout likely to trigger a rally.
- On-chain and derivatives data paint a bullish outlook as a spike in fee collection and bullish bets reach the highest monthly level.
- The technical outlook signals fading bearish momentum, reinforcing the case for an upcoming upside move.
Litecoin (LTC) price trades within a falling wedge pattern around $112.5 at the time of writing on Thursday, with a breakout likely to trigger a rally ahead. On-chain activity and derivatives data support a bullish outlook as LTC’s fee collection hits a seven-month high and bullish bets reach their highest monthly level. The technical momentum suggests that bulls may soon regain control, opening the door for a potential rally.
Litecoin’s growing interest among traders
According to Artemis Terminal data, Litecoin fee collection has spiked from $1,000 on Saturday to $2,100 on Monday, the highest level since January 26, indicating a growing interest among traders and liquidity in the LTC chain.
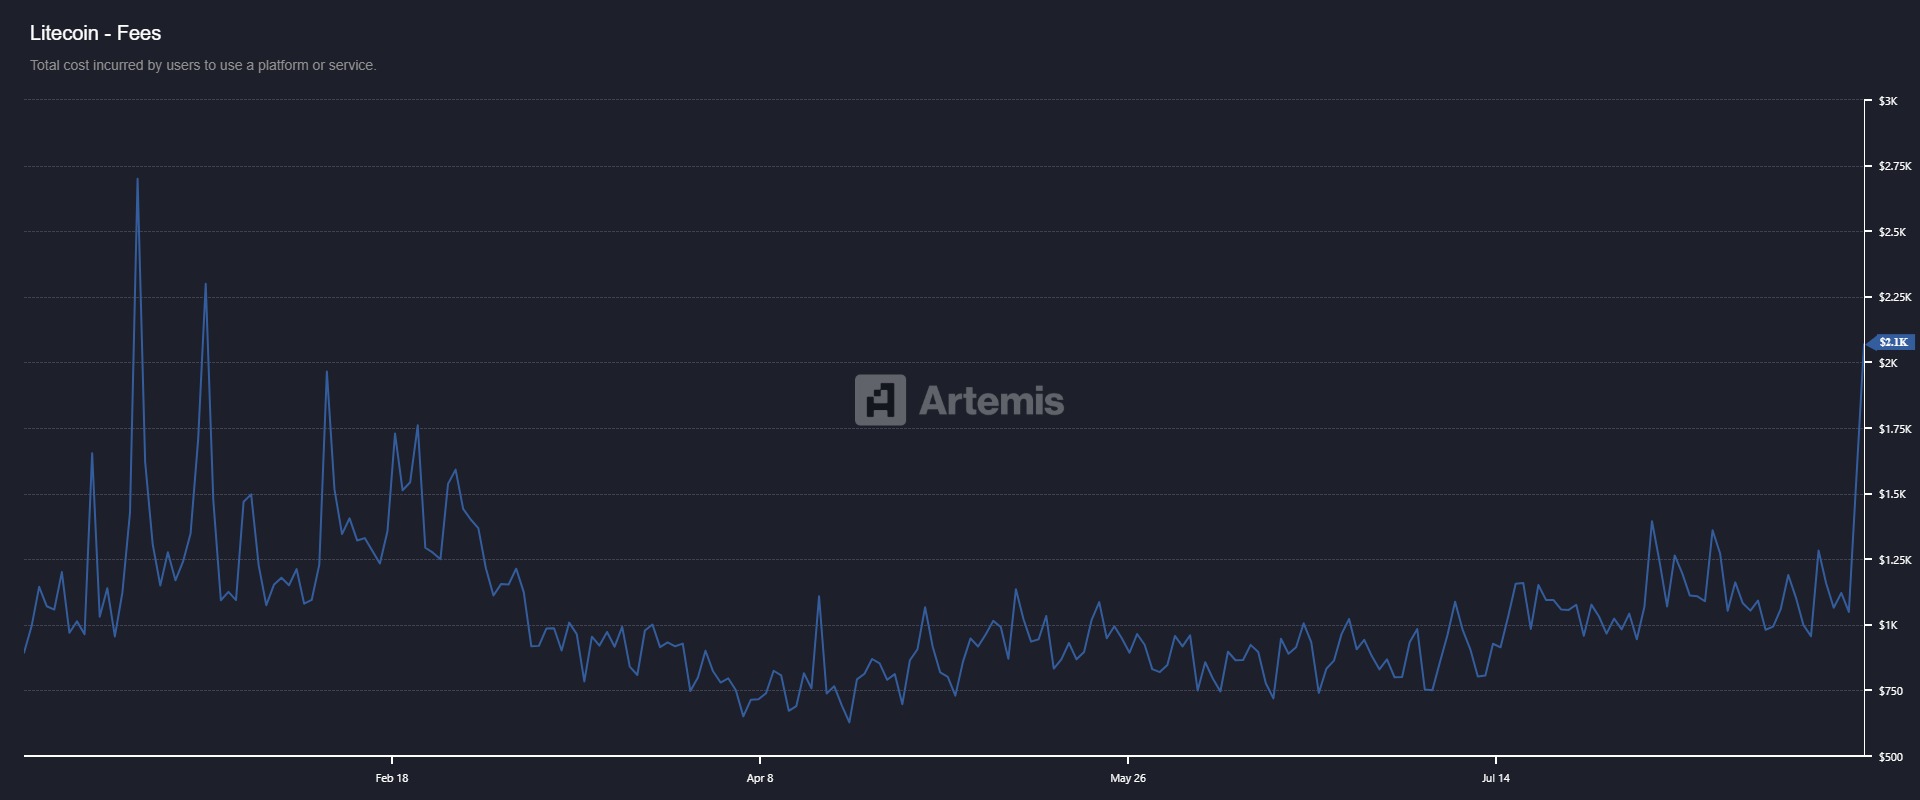
Litecoin fees chart. Source: Artemis
Coinglass’s long-to-short ratio of LTC further supports the bullish outlook. The ratio currently stands at 1.11, the highest level over a month, indicating traders are betting on the asset price to rally.
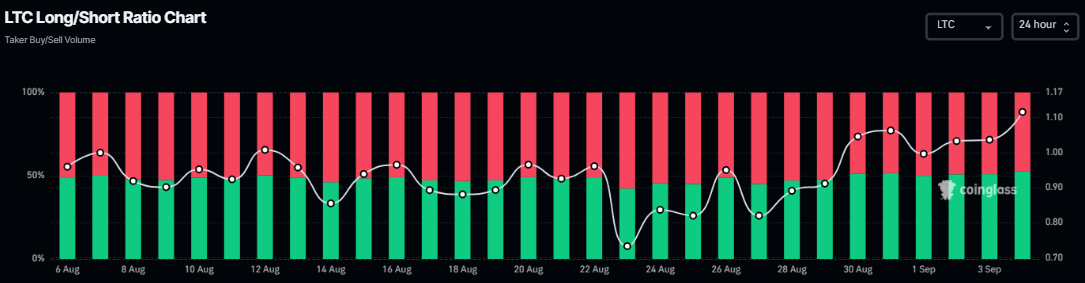
Litecoin long-to-short chart. Source: Coinglass
Apart from these, LTC hash rate has tripled in just over 18 months, signaling stronger network security and growing miner confidence in the ecosystem.

Litecoin Price Forecast: LTC could rally if it breaks above the falling wedge pattern
Litecoin price trades within the falling wedge pattern (drawn by connecting multiple highs and lows with two trendlines since early August). A breakout of this pattern generally favors the bulls. LTC price found support around its 100-day EMA at $106.13 on Monday and recovered 4% in the next two days. At the time of writing on Thursday, it trades around $112.54.
If LTC breaks above the upper boundary of the wedge pattern, it could extend the rally toward its August 14 high of $134.29.
The Relative Strength Index (RSI) on the daily chart reads 48, nearing its neutral level of 50, indicating a fading of bearish momentum. The Moving Average Convergence Divergence (MACD) lines are also nearing each other with decreasing red histogram bars, suggesting a bullish crossover could happen in the coming sessions.
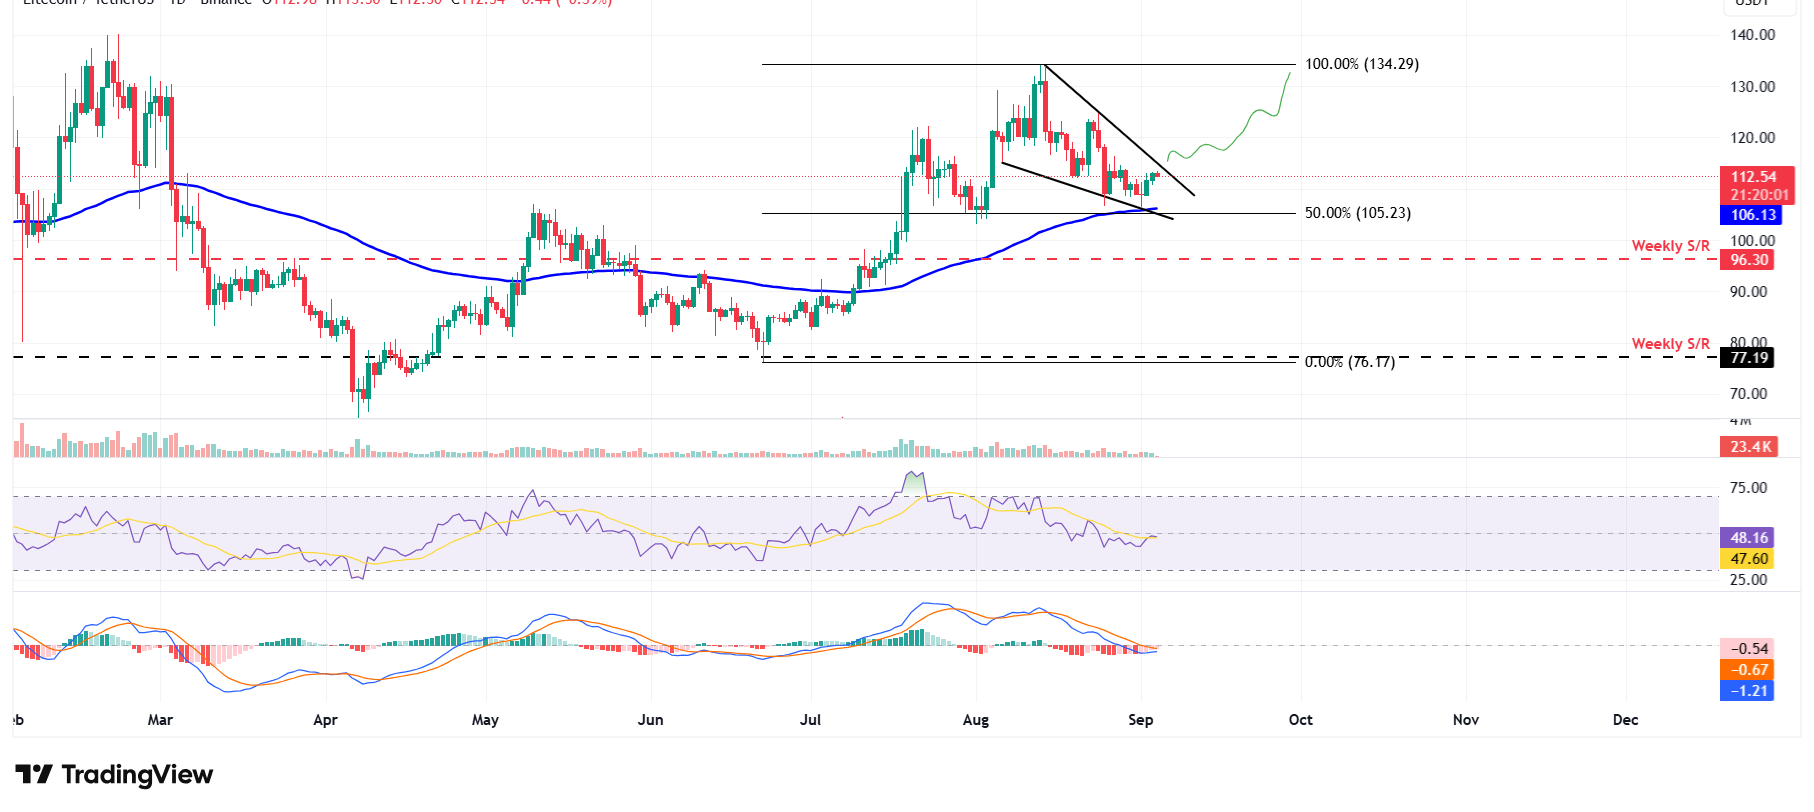
LTC/USDT daily chart
However, if LTC faces a correction, it could extend the decline to find support around its 100-day EMA at $106.13.
Recommended Articles











Comments (0)
Click the $ button, enter the symbol, and select to link a stock, ETF, or other ticker.