


Litecoin Price Forecast: LTC struggles below resistance, bearish bets hit monthly high



- Litecoin price faces rejection at its key resistance level, suggesting a dead-cat bounce is in play.
- Sidelined investors looking to short LTC could do so between $93 and $95.
- Derivatives data also paints a bearish picture, as LTC's bearish bets among traders reach their highest level in over a month.
Litecoin (LTC) is showing signs of weakness on Thursday as it fails to break above its key resistance level. The price action emerges as a classic dead-cat bounce pattern, which favors bears. The technical outlook suggests that sidelined traders looking to short LTC could consider entry points between $93 and $95 in anticipation of the price resuming its downtrend. Additionally, the bearish sentiment is building among traders, with short positions in the derivatives market reaching their highest point in over a month.
Litecoin's bearish bets reach the highest level in over a month
According to Coinglass's data, the long-to-short ratio of Litecoin reads 0.82. This ratio, below one, reflects bearish sentiment in the markets, as more traders are betting on the asset price to fall.

LTC long-to-short ratio chart. Source: Coinglass
Litecoin Price Forecast: Dead-cat bounce scenario develops
Litecoin price broke and closed below its ascending trendline (drawn by connecting multiple lows since early April) and its 200-day Exponential Moving Average at $93.30 on May 30 and declined 8.2% until June 5. However, it had a short-term price recovery in the next 5 days and retested the 200-day EMA at $93.30. On Wednesday, LTC experienced a dead-cat bounce scenario—a brief price increase within a broader downtrend—facing rejection from the 200-day EMA level at $93.30. This level roughly coincides with the 50% price retracement level at $95.18, making these levels a crucial reversal zone. At the time of writing on Thursday, it edges slightly at around $91.25.
Sidelined investors looking to short LTC can do so between the $93.30 and $95.18 ranges, with the stop-loss set slightly above its weekly resistance at $96.30.
If LTC faces correction from the levels mentioned above, it could extend the decline to retest its Saturday low of $83.31. A successful close below this would extend the losses to retest the next weekly support level at $77.19.
The Relative Strength Index (RSI) on the daily chart hovers around the neutral level of 50, indicating indecisiveness among traders. For the dead-cat bounce scenario to play, the RSI must move below its neutral level of 50 for the bearish momentum to be sustained.
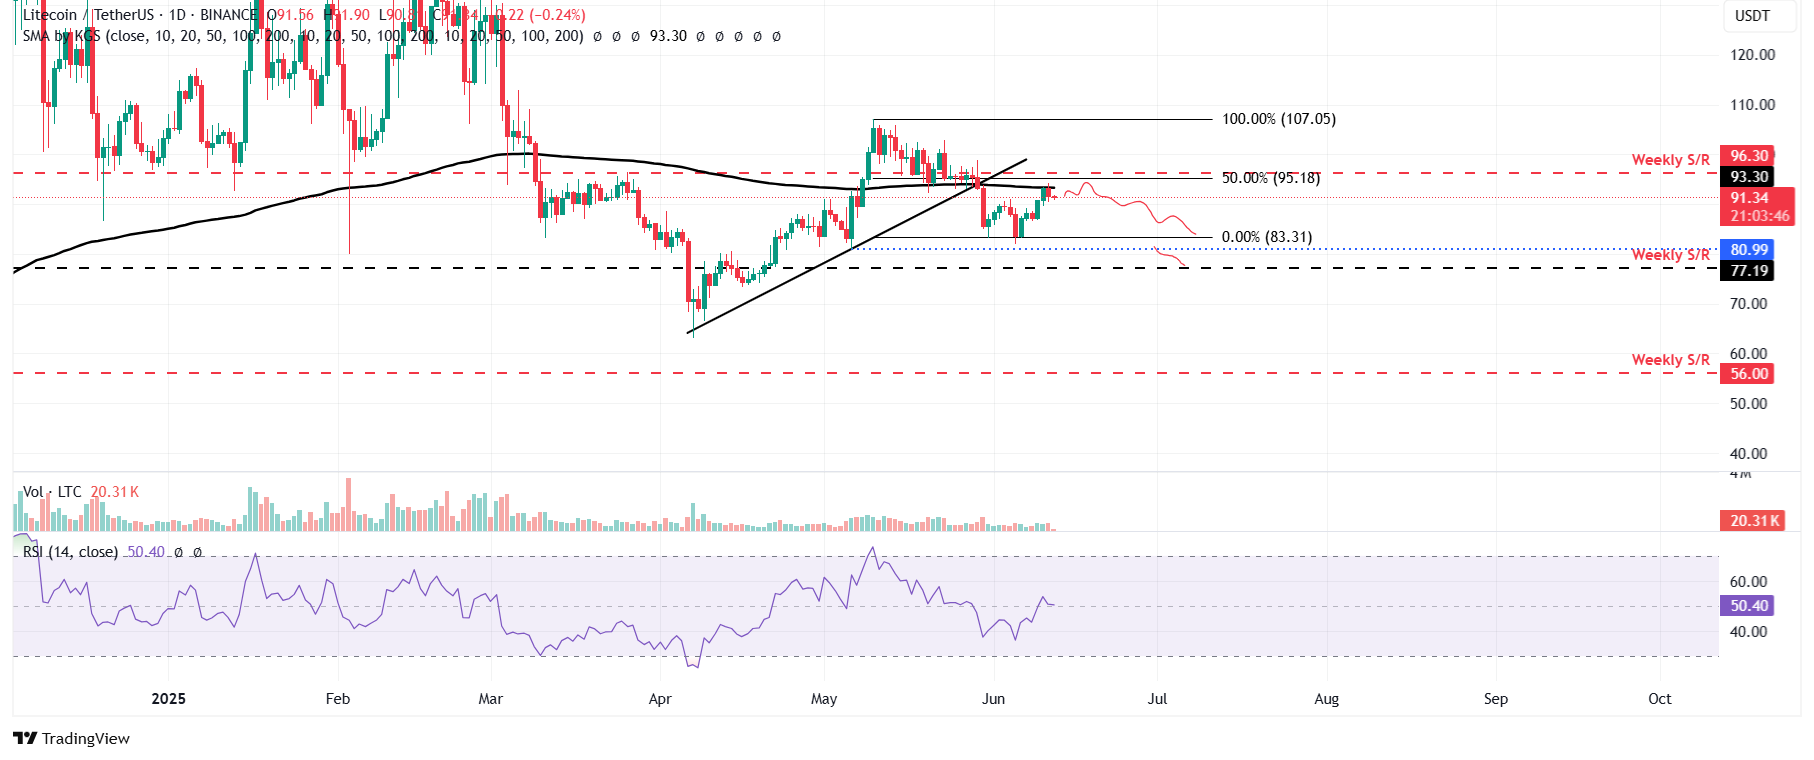
LTC/USDT daily chart
However, if the Litecoin price closes above the weekly resistance at $96.30, the bearish thesis would be invalidated. Such a scenario could extend the rally toward the May 10 high of $107.05.
Recommended Articles









Comments (0)
Click the $ button, enter the symbol, and select to link a stock, ETF, or other ticker.