


VeChain Price Forecast: VET bulls aim for a double-digit rally



- VeChain price breaks above a falling wedge pattern, projecting a bullish outlook.
- Bybit announces the listing of VET on its exchange.
- The technical outlook suggests rallying ahead, targeting double-digit gains.
VeChain (VET) price hovers around $0.023 on Tuesday after breaking above a falling wedge pattern the previous day; a breakout of this pattern favors the bulls. Bybit announced on Monday that VET would be listed on its exchange. Moreover, the technical outlook suggests rallying ahead, targeting double-digit gains.
Bybit lists VET on its exchange
Bybit, a centralized crypto exchange, announced Monday that it will list VeChain on its Spot trading platform. The listing process will begin with VET deposits opening on Monday at 6 AM UTC. Trading will commence at 10 AM UTC the same day, with withdrawals available from Tuesday at 10 AM UTC. The listing of VeChain on Bybit indicates a bullish outlook for the VET token as it boosts liquidity and accessibility for VeChain’s ecosystem.
VeChain bulls target 17% gains
VeChain price broke above the falling wedge pattern (drawn by connecting multiple high and low levels with two trendlines from early February) on Monday and rose almost 3% that day. The breakout of this pattern favors the bulls. At the time of writing on Tuesday, it trades slightly above $0.023.
If VET continues its upward momentum, it could extend the rally by 17% from its current levels to retest its high of $0.027. A successful close above this could extend an additional rally by 21% to test its March 3 high of $0.033.
The Relative Strength Index (RSI) on the daily chart reads 51, pointing upward above its neutral level of 50, indicating bullish momentum. Moreover, the Moving Average Convergence Divergence (MACD) indicator also showed a bullish crossover last week, giving buy signals and suggesting a continuation of an upward trend.
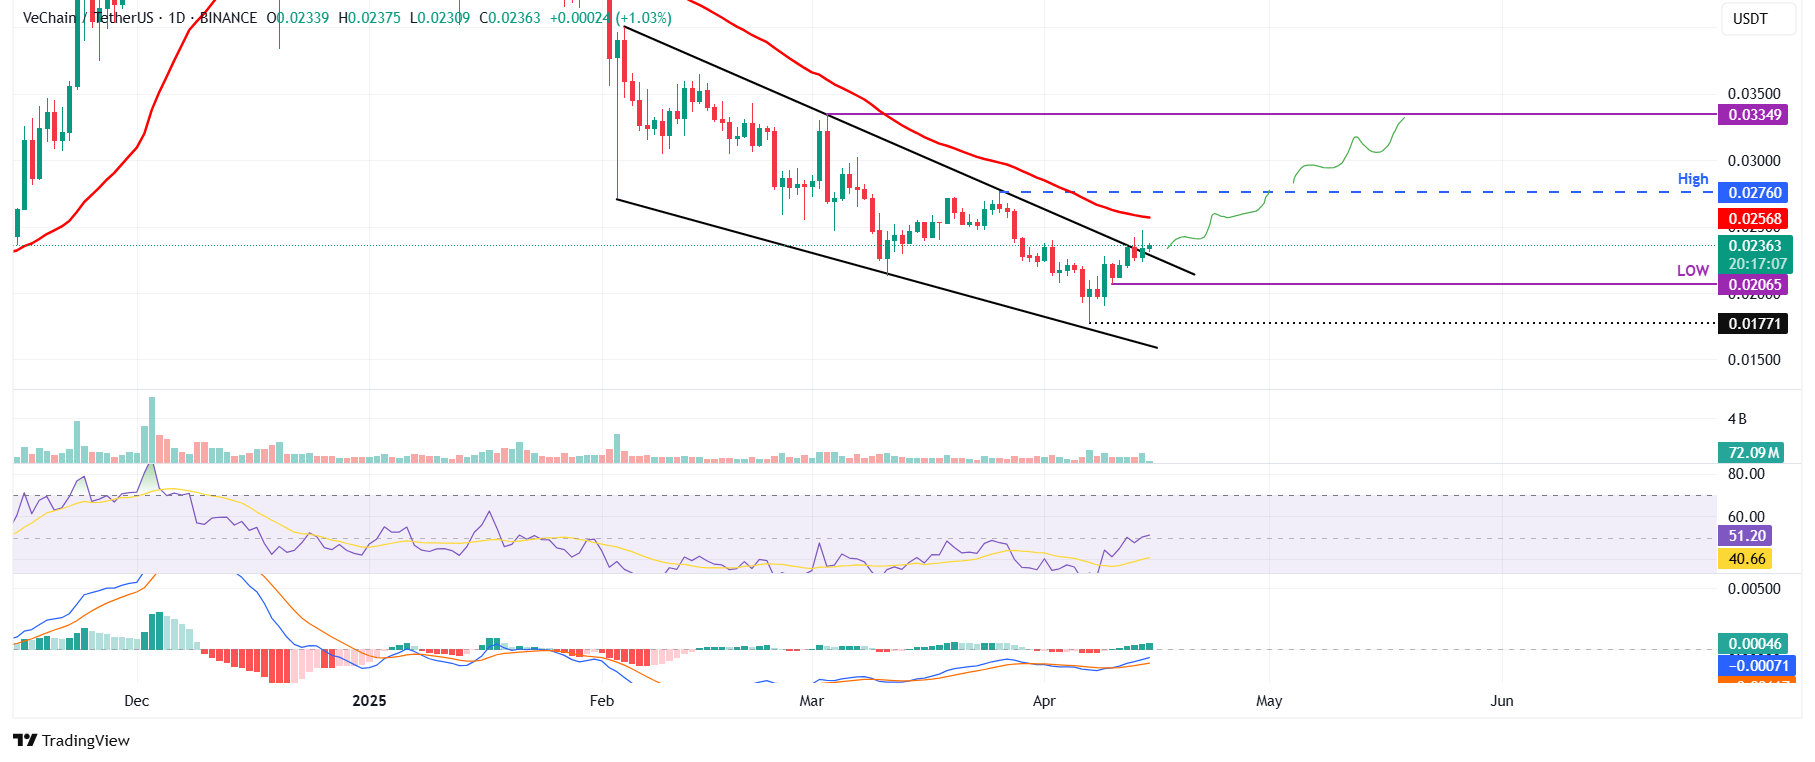
VET/USDT daily chart
However, if VET declines and closes below the April 10 low of $0.020, the bullish thesis will be invalidated. This development would lead to a price decline to retest its next support level at $0.017.
Recommended Articles









Comments (0)
Click the $ button, enter the symbol, and select to link a stock, ETF, or other ticker.