


Cardano Price Forecast: Bears aiming for a yearly low of $0.50 as on-chain data show increasing dormant wallet activity



- Cardano’s price hovers around $0.56 on Wednesday after falling 13% the previous week.
- Token Terminal data shows that ADA’s fee collection has been constantly falling in 2025.
- The technical outlook and on-chain metrics suggest a correction as dormant wallet activity increases.
Cardano (ADA) price hovers around $0.56 on Wednesday after falling 13% the previous week. Token Terminal data shows that ADA’s fee collection has constantly fallen in 2025, indicating lower blockchain usage and activity. The technical outlook and on-chain metrics suggest a correction as dormant wallet activity increases.
Cardano dormant wallet activity rises while netflow turns negative
Santiment’s Age Consumed index projects a bearish outlook for Cardano. The spikes in this index suggest dormant tokens (tokens stored in wallets for a long time) are in motion, and it can be used to spot short-term local tops or bottoms.
In the case of ADA, history shows that the spikes were followed by a fall in Cardano’s price as holders moved their tokens from wallets to exchanges, thereby increasing the selling pressure.
The most recent uptick on Monday was the highest spike since mid-January and also forecasted that ADA was ready for a downtrend.
 [11-1744190059140.41.10, 09 Apr, 2025].png)
ADA Age Consumed chart. Source: Santiment
Coinglass’s ADA spot netflow data also gives a negative outlook. The data shows that ADA’s spot netflow has been constantly negative since mid-March, and as of this week, it recorded $21.08 million in outflows.
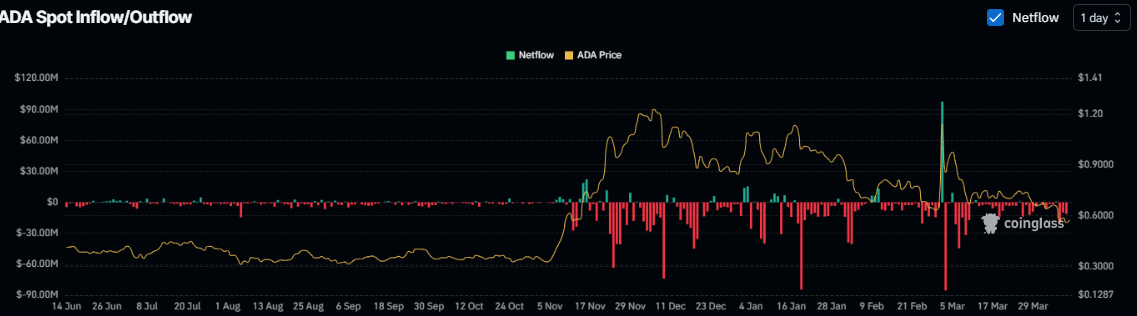
ADA Spot Inflow/outflow chart. Source: Coinglass
Additionally, Token Terminal data shows that Cardano’s fee generation has fallen considerably from $663,400 in January to $53,000 on April 9. This fee fall indicates lower blockchain usage and activity, which doesn’t bode well with Cardano’s price.

ADA fee generation chart. Source: Token Terminal
Cardano Technical Outlook: ADA bears aim for $0.50 mark
Cardano’s weekly chart shows that ADA extended the decline below the 61.8% Fibonacci retracement (drawn from its August 5 low of $0.27 to the December 3 high of $1.32) at $0.67 and lost 13.23% last week, retesting the February 28 low of $0.58 on Friday. As of this week, ADA bounced slightly after dipping and finding support around $0.51 on Monday. At the time of writing on Wednesday, ADA hovers around $0.56.
If ADA continues its downward momentum, it could extend the decline to test the year-to-date low of $0.50 set on February 3.
The Relative Strength Index (RSI) on the weekly chart reads 44 and points downward, indicating bearish momentum.
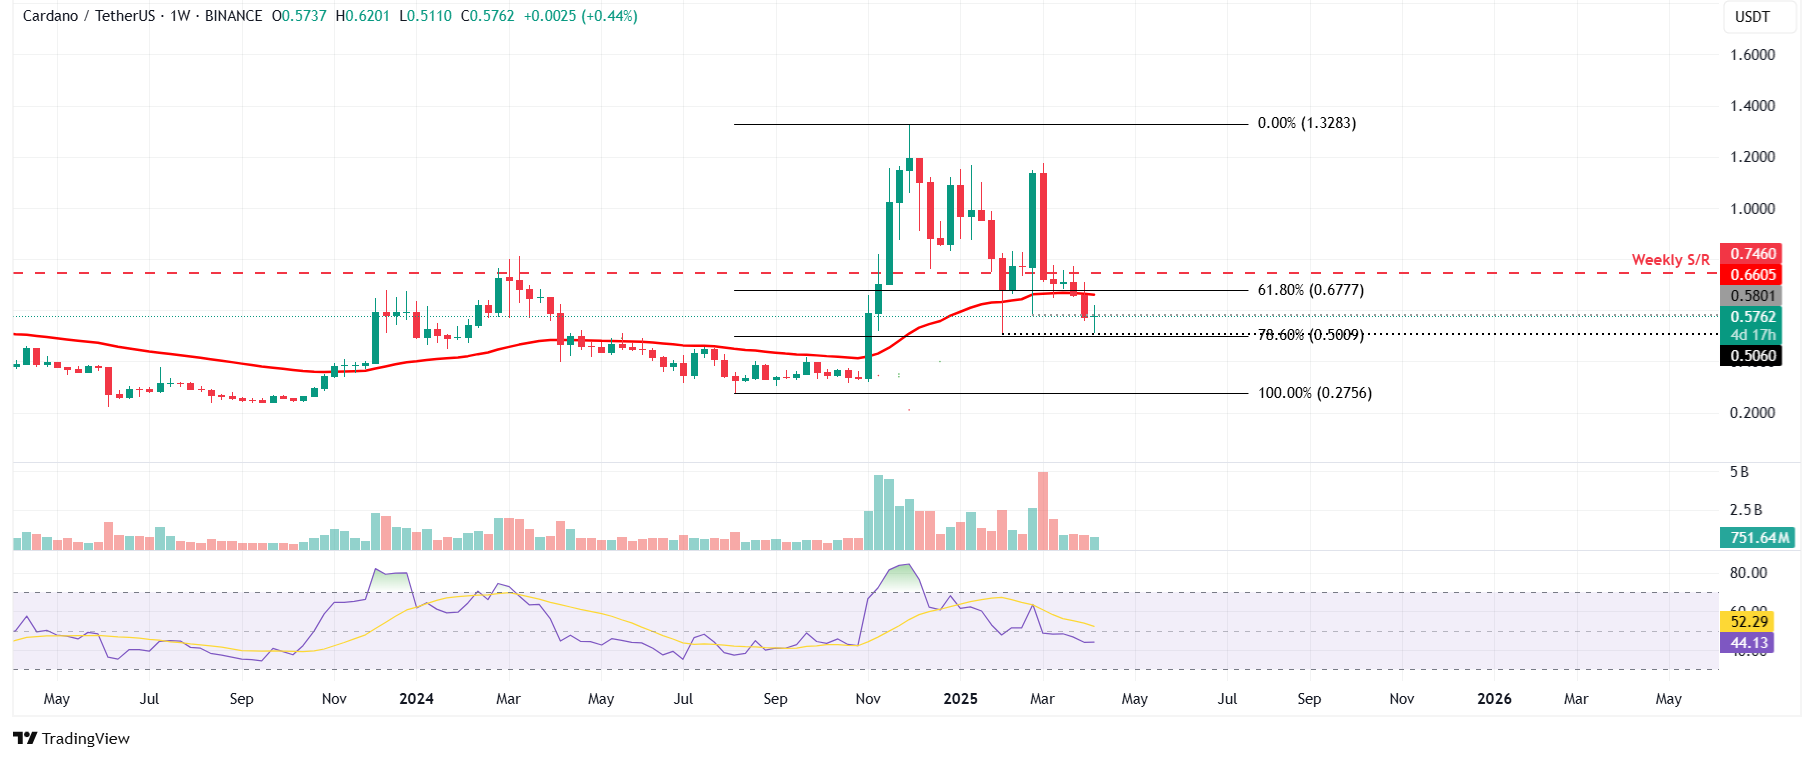
ADA/USDT weekly chart
However, if ADA recovers, it could extend the positive move to retest the 50-week Exponential Moving Average (EMA) at $0.66.
Recommended Articles







Comments (0)
Click the $ button, enter the symbol, and select to link a stock, ETF, or other ticker.