


ORCL: Big Bet on AI Compute—Are the Odds Enough?



Per Dolphin Research's earlier coverage, our core takeaway is that Oracle essentially resembles a scaled-up CoreWeave. The key swing factor is that surging AI compute demand could drive its compute rental revenue up by an order of magnitude or more. The main risk is the uncertainty of AI demand vs. committed upfront capex and leverage, which could translate into sizable bad debts if the AI cycle fizzles.
Overall, the stock is a high-beta, event-driven name with limited visibility, where upside and downside are both material. Risk and opportunity coexist, and the payoff profile is wide in both directions.
Within this valuation note, we focus on several questions. These include: the composition and outlook of Oracle's legacy vs. AI businesses; the AI compute revenue implied by guidance and its achievability; the impact of AI-driven capex and leverage and the resulting profit contribution; and Oracle's value across scenarios.
The detailed analysis follows. See below for the full breakdown.
I. Forecast framework — building blocks
As discussed in our prior note, Oracle is currently split into two stark poles. On one side, everything outside OCI is effectively in a 'mature run-off' state, with OCA SaaS growing a little above 10% and Software, Hardware, and Services hovering at low single-digit growth.
This set of businesses still accounts for ~70% of total revenue in FY26. They offer few catalysts but high visibility, with relatively predictable revenue, high software-like GPM (typically 60%–70%+), and stable cash flow. Think of this as the 'base' layer of Oracle’s business and valuation stack.
On the other side sits the pivotal OCI segment (IaaS + PaaS), where opportunity and risk are both significant. Under the company's FY25–FY30 long-term guide, total revenue would grow from ~$57bn to ~$225bn (~4x), with ~92% of the ~$155bn incremental revenue coming from OCI, potentially even more if AI outperforms.
The flip side is that AI compute demand is concentrated in a handful of large customers and requires massive upfront capex. Oracle posted roughly $10bn net cash outflow across two consecutive quarters, and interest-bearing debt stands at ~2.4x book equity, implying a heavy balance sheet risk and a non-trivial chance of equity impairment if things go wrong.
In short, uncertainty is extreme. AI could multiply revenue several times, or aggressive build-out and execution missteps in compute could inflict heavy losses on the company and shareholders.
To address this bifurcation, we split our valuation framework in two steps. First, we outline non-OCI 'base' businesses to derive a base value, then layer in OCI outcomes under different scenarios to arrive at consolidated valuation.
1.1 Overview of 'base' businesses
With the framework set, we first underwrite expectations for the non-OCI base as the foundation. The 'base' comprises four parts under the Cloud umbrella: OCA SaaS, traditional software (license + support), hardware sales (servers, databases, etc.), and consulting services (e.g., training).
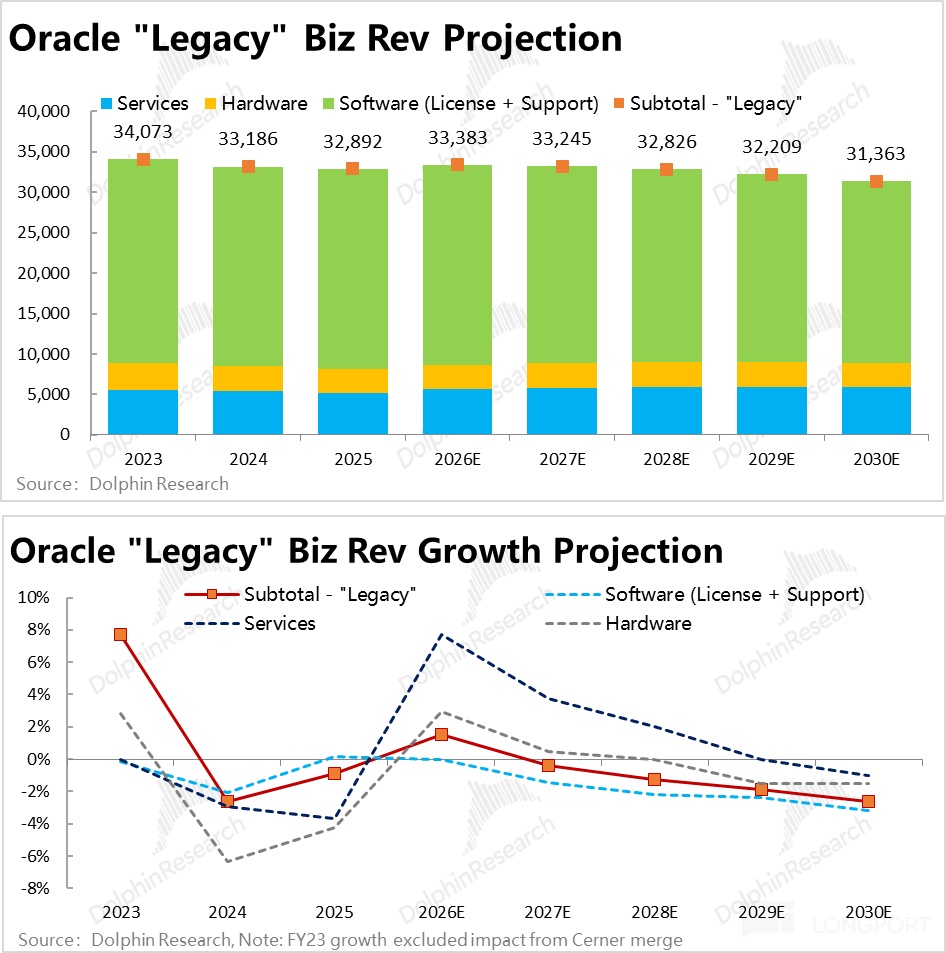
Software + Hardware + Consulting — gradual decline: For these three legacy lines, given historical trends and the secular cloud- and AI-shift, our conservative baseline assumes low single-digit YoY revenue declines will continue. This approach is simple, prudent, and anchored in recent performance.
The chart below shows our detailed forecast. In aggregate, we model the three 'base' segments at a -2% revenue CAGR during FY26–FY30.
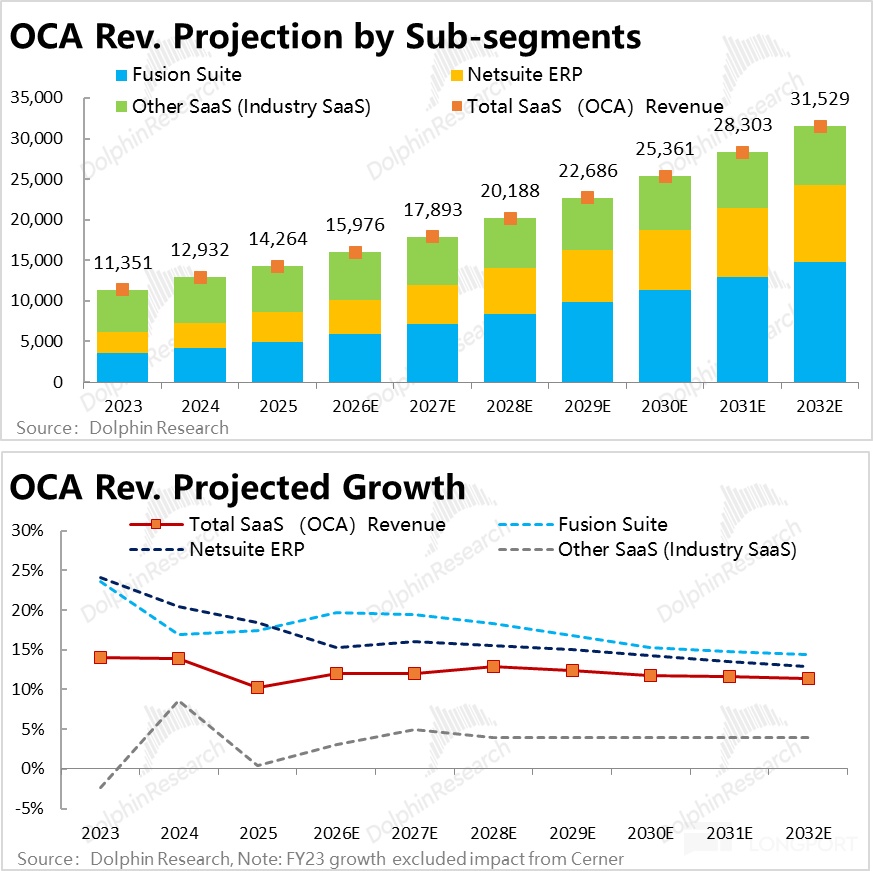
OCA steady growth: OCA SaaS (just over 20% of total revenue) can be split into two lines. a) Strategic Back-Office, covering ERP/HCM/SCM; and b) other offerings, mainly industry vertical SaaS, where Oracle is relatively weaker and growth has hovered around low single-digit +/- in recent years.
The dominant Back-Office line (60%+ of OCA) further splits by customer segment into Fusion (for large enterprises) and NetSuite (for SMBs and startups). Disclosures show Fusion ERP and NetSuite ERP each did roughly $1.1bn per quarter over the past two quarters, together contributing ~55% of OCA revenue, underscoring their strategic weight.
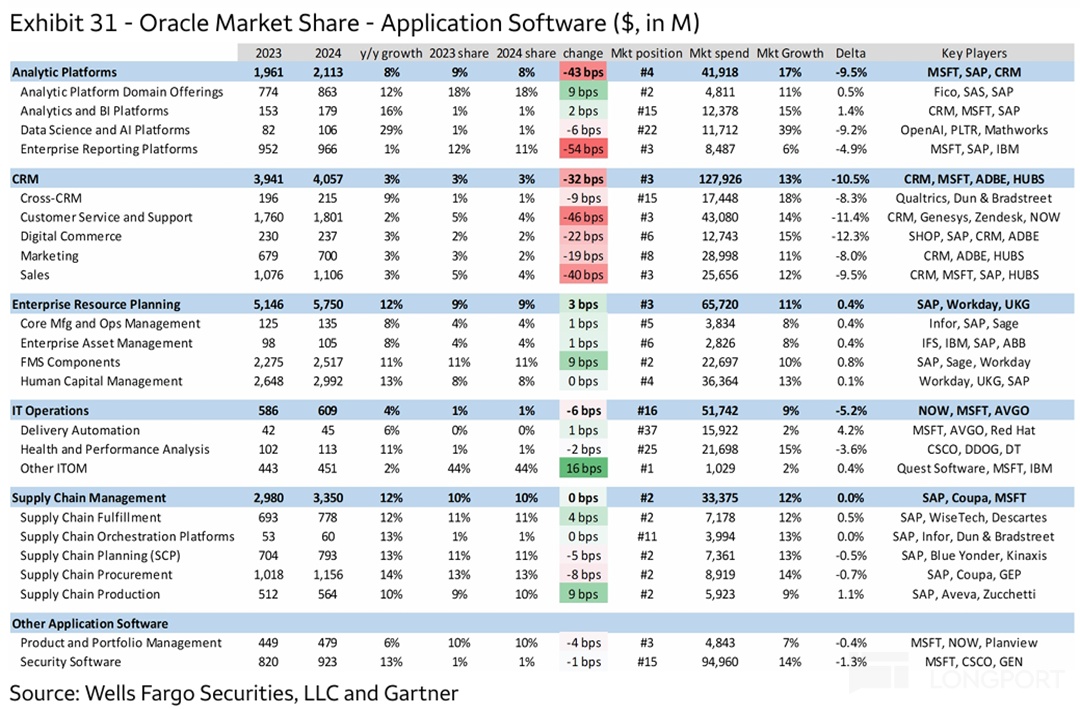
Cross-checking industry data, Oracle is a top-tier player in back-office applications, typically Top 3 by share. In CRM/ERP/SCM, its share ranks second or third behind SAP and Salesforce, while in Analytics and IT Ops its rankings are lower, highlighting a clear strength differential.
On forecasts, Fusion and NetSuite ERP grew ~15%–25% in the past 2–3 fiscal years, with solid momentum. Given Oracle’s leadership in back-office, we assume Strategic Back-Office grows ~15%–16% CAGR in FY26–FY30, lifting OCA’s overall revenue growth to ~12% on Avg. over the same period.
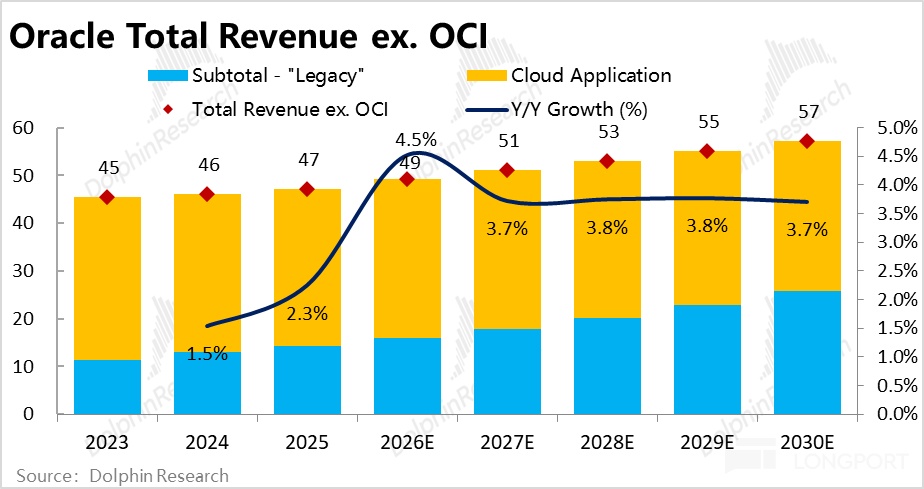
Summing legacy plus OCA SaaS, we expect non-OCI revenue to rise from ~$49bn in FY26 to ~$56.7bn in FY30 (CAGR ~3.6%). That is ~100bps below the CAGR implied by company guidance, reflecting our conservative tilt.
What could drive deviations from this base? On the downside, rapid AI diffusion could cannibalize traditional enterprise software (including SaaS), causing a cliff, not a slow fade. On the upside, a breakout in OCI could attract new customers and enable cross-sell, lifting the 'base' as well.
We think large-scale cross-sell from AI compute is unlikely near term, as compute leasing customers are concentrated in hyperscalers and AI labs, not the broader enterprise base. It is hard to see OpenAI adopting Oracle SaaS or databases solely because it rents compute from Oracle.
Conversely, AI replacing traditional software is not a high near-term probability, but the pace of iteration is fast enough that it cannot be dismissed. Net-net, negatives are likelier than positives in the medium term, so we prefer to be conservative rather than optimistic on legacy Software/Hardware growth.
1.2 Deep dive into OCI
We now break down OCI further. Referencing external work, OCI can be split into Legacy Hosting, Database (cloud DB), and Core OCI — the narrower IaaS compute rental (we group Legacy + cloud DB as Non-Core).
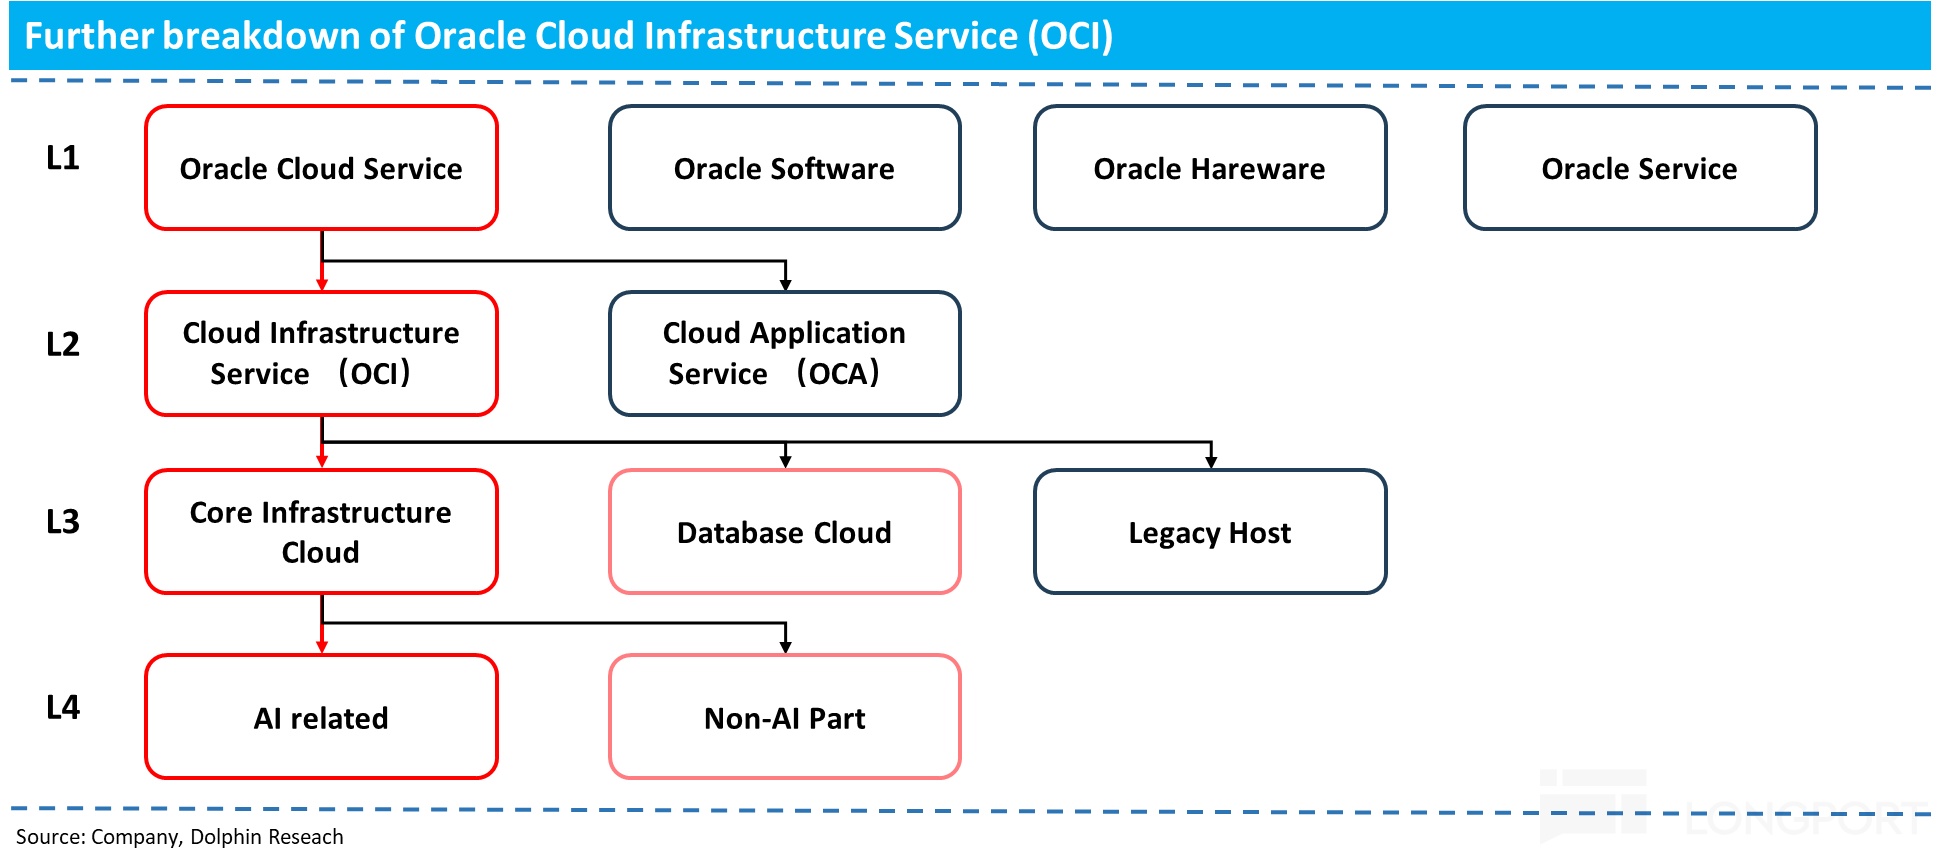
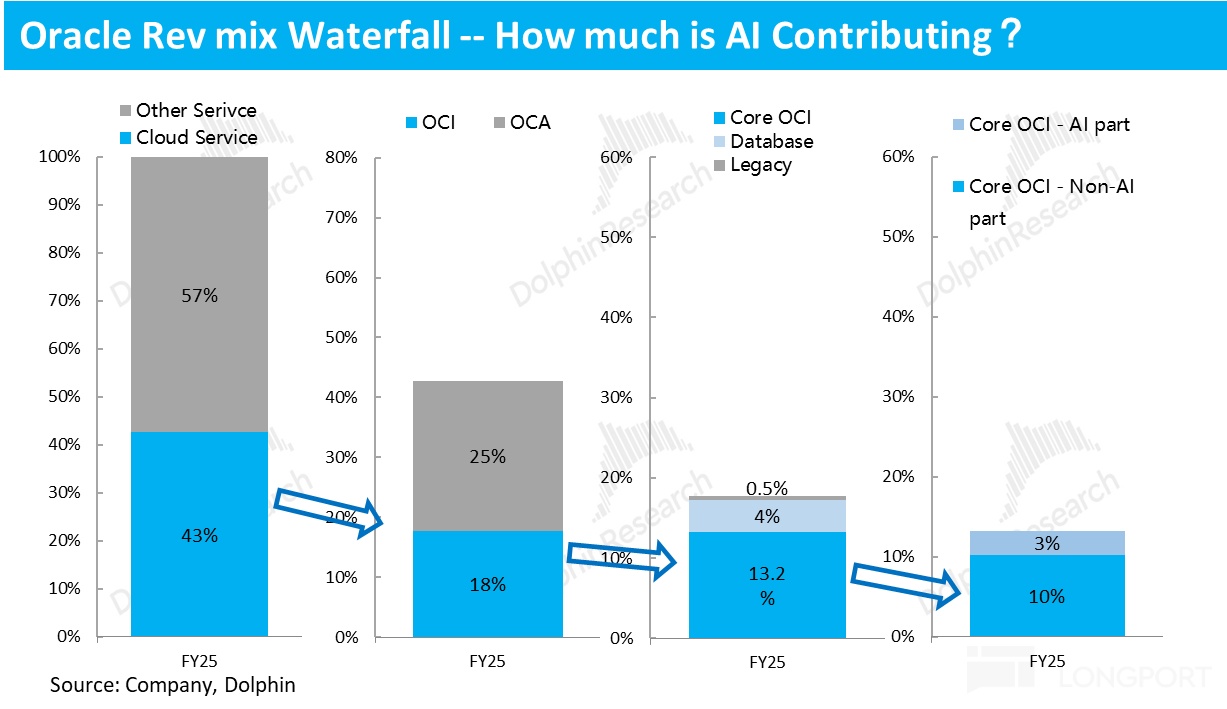
1) Legacy Hosting: primarily Gen1-era residue and managed hosting for on-prem or third-party cloud deployments of Oracle software/databases. It is less than 3% of OCI revenue, shrinking slowly, and strategically insignificant.
2) Database: one of Oracle’s most differentiated franchises since inception, with flagships like Autonomous Database and Exadata Cloud Service (ExaCS). Street estimates put FY25 OCI Database revenue at ~$2.0–2.1bn (22%–23% of OCI), still growing ~20%–30%+ YoY in FY24–FY25, underscoring solid momentum.
3) Core OCI: stripping out the above leaves Core OCI, i.e., IaaS rentals of compute/storage/network via bare metal, VMs, or large clusters. We estimate Core OCI at $7.5bn+ in FY25, roughly three-quarters of OCI.
We further split Core OCI into AI-related and non-AI. This helps isolate the true swing factor embedded in AI compute.
a. Non-AI compute is also growing fast: Based on external splits, FY25 non-AI (CPU-centric, enterprise-focused) was just under $6bn, still larger than AI, and grew ~40%–50% YoY in FY24–FY25. Even without the AI wave or the OpenAI mega-deal, Core OCI has substantial runway, as its share of total IaaS remains ~5% in FY25, leaving room for catch-up.
b. AI compute — the wild card: The remaining piece is AI compute rental (GPU-led), still small in base but with outsized impact. We estimate AI compute revenue was under $2bn by FY25 (~3% of total revenue), but is growing rapidly, with FY23–FY26 revenue growth projected at 200%+ per year.
1.3 How big can OCI revenue get?
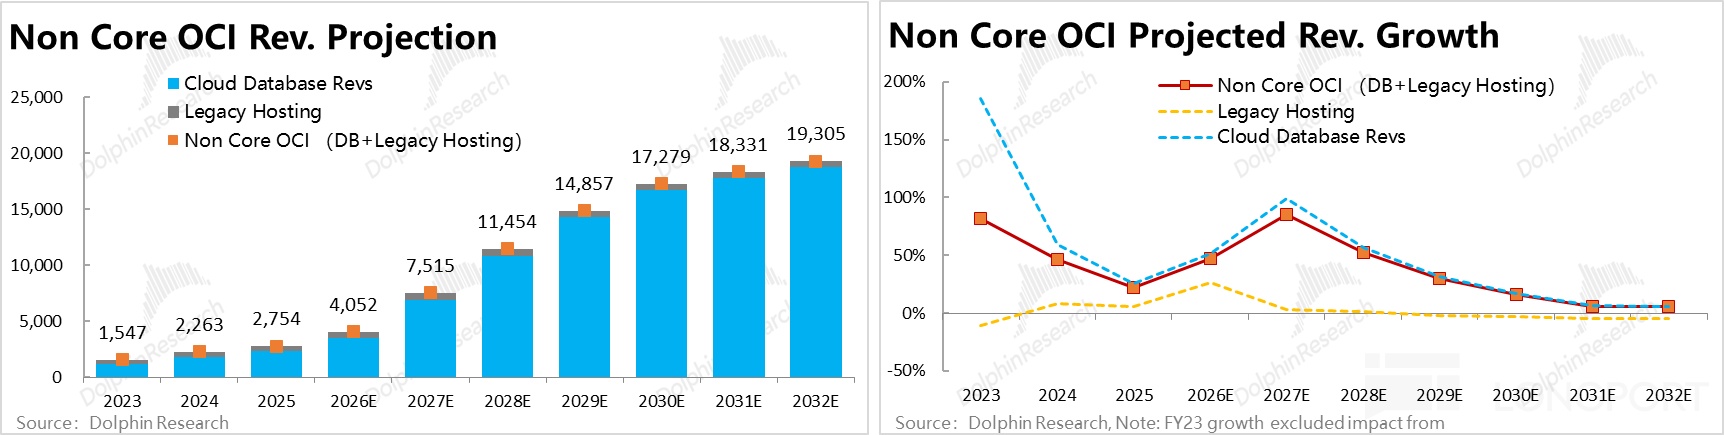
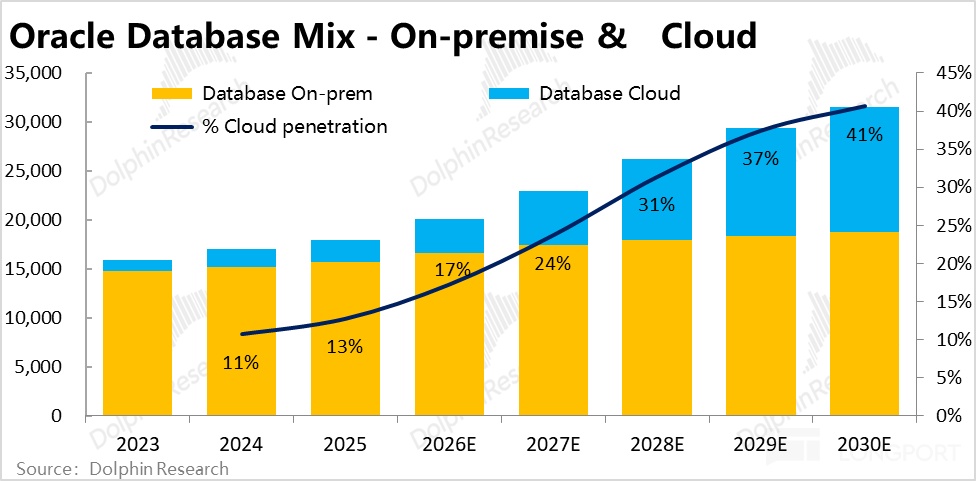
1) Non-Core OCI Legacy Hosting is tiny and should keep shrinking at low single-digit negative YoY as AI and cloud progress. For cloud Database, we expect continued healthy growth for two reasons: it is a traditional strength with solid recent momentum, and by FY25 cloud DB was still under 15% of the database revenue under the legacy license model, leaving ample room for on-prem to cloud migration.
2) Core OCI Given high uncertainty on AI, pinning down five-year compute demand is hard. We therefore take company guidance as the base case, then test achievability and adjust accordingly.
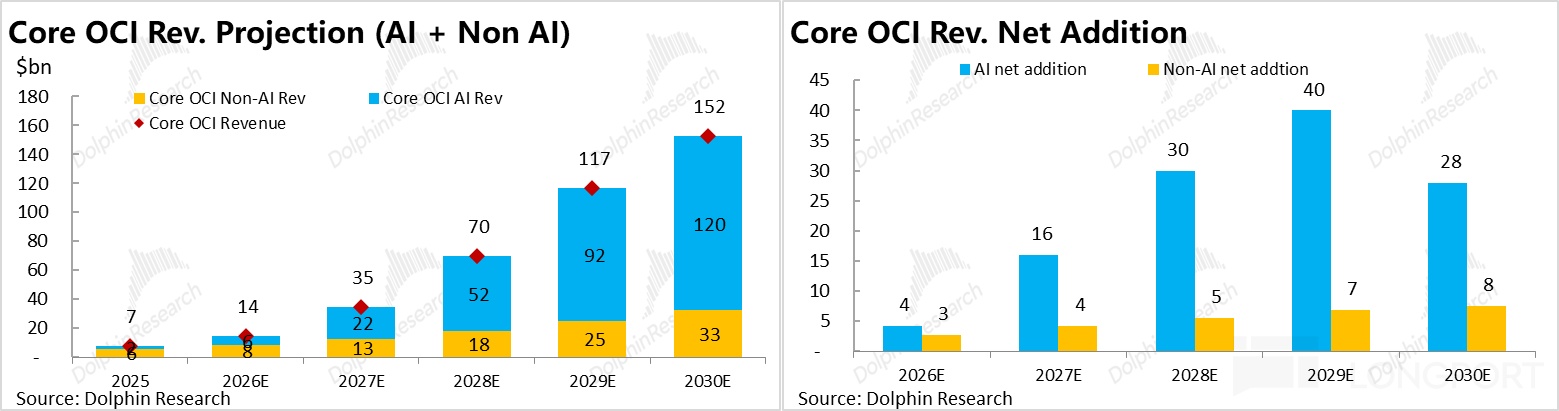
Per the latest post-F3Q26 guide for OCI and stripping out Non-Core, implied Core OCI revenue would need to surge from ~$14bn in FY26 to ~$150bn+ in FY30. Within that, AI would jump from under ~$6bn in FY26 to ~$120bn in FY30, while non-AI would climb from ~$8bn to ~$33bn (CAGR ~42%).
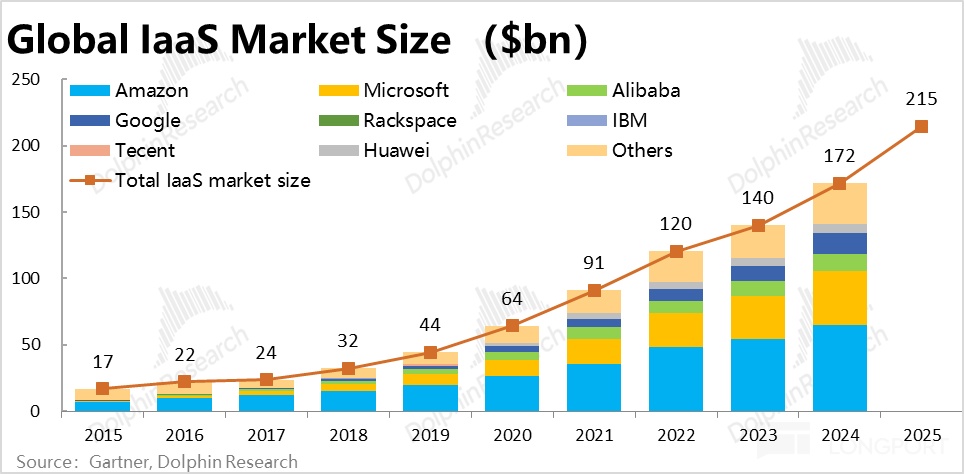
How large is $150bn of IaaS revenue? Two lenses help. a) Gartner pegs global IaaS at ~$215bn in CY25 (IaaS only, smaller than total cloud). So Core OCI at FY30 (≈CY29) would be over 60% of CY25 global IaaS.
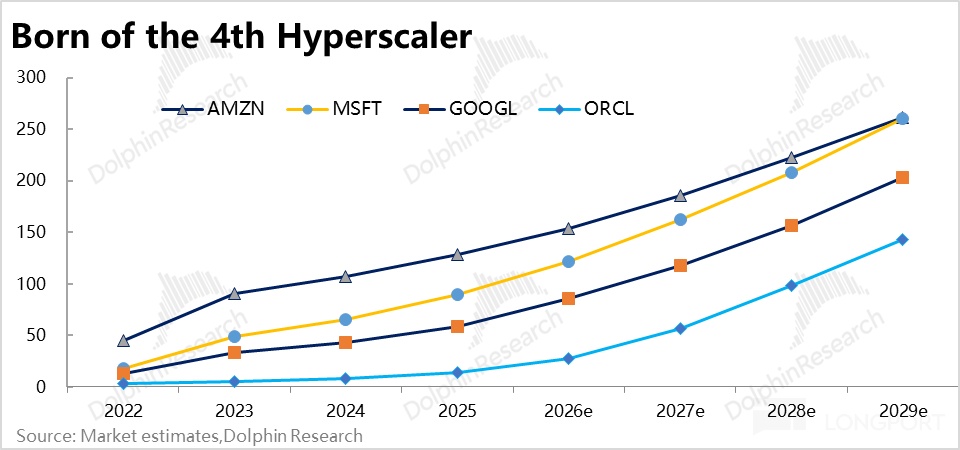
b) On a dynamic basis, by FY30 total OCI (IaaS + DB + Legacy) would approach Google Cloud’s size and ~50%–55% of AWS/Azure, making Oracle the fourth hyperscaler. This frames the magnitude of the ambition.
II. Can Core OCI hit the revenue target?
2.1 Cross-checks suggest ~$100bn is more realistic Because valuation hinges on Core OCI’s realized revenue, we triangulate achievability via several methods. The aim is to gauge whether Oracle can credibly land the target scale by FY30.
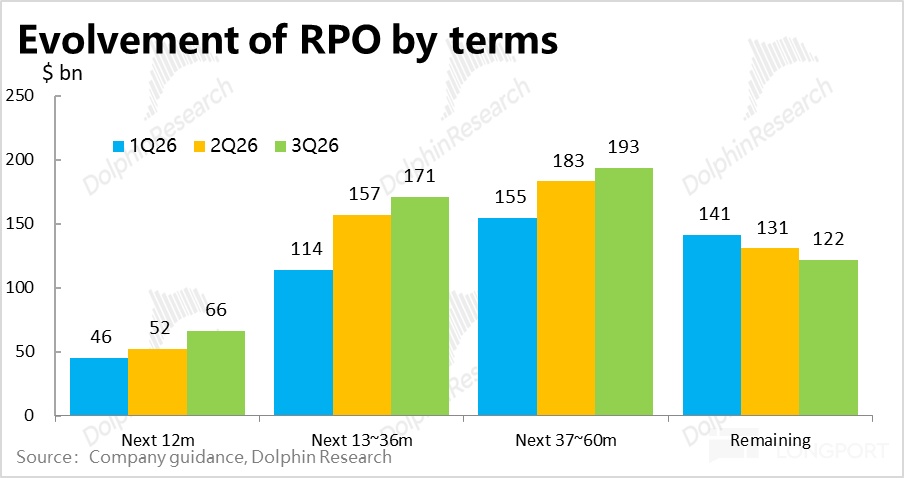
1) Method 1 — RPO coverage: Using the latest post-F3Q26 RPO against our Core OCI base case, the 13–36 month backlog of ~$17.1bn covers 91%+ of combined FY28–FY29 Core OCI revenue. However, the 37–60 month backlog of ~$19.3bn covers only ~58% of combined FY30–FY31 Core OCI revenue.
Put simply, current orders support a peak annual Core OCI revenue of roughly ~$100bn at best. That leaves a notable gap to the $150bn FY30 target. Note: while Oracle does not break RPO by product, sell-side work suggests 90%+ relates to OCI, with OCI’s share higher in longer-dated RPO, so we attribute 12M+ RPO primarily to OCI/Core IaaS for this check.
2) Method 2 — Is supply sufficient? Management indicates 1 GW of data center capacity can generate about ~$10bn in annual revenue. Two data points support this: the OpenAI–Oracle 5-year ~$300bn contract covers ~6 GW (≈$10bn/GW/yr), and CoreWeave’s FY25 4Q run-rate revenue of ~$6.3bn against an Avg. ~0.75 GW online implies ~$8.8bn/GW/yr.
So ~$10bn/GW/yr for Oracle is reasonable, and appears slightly higher than CoreWeave. This implies Oracle needs ~15 GW of online capacity to meet the Core OCI target.
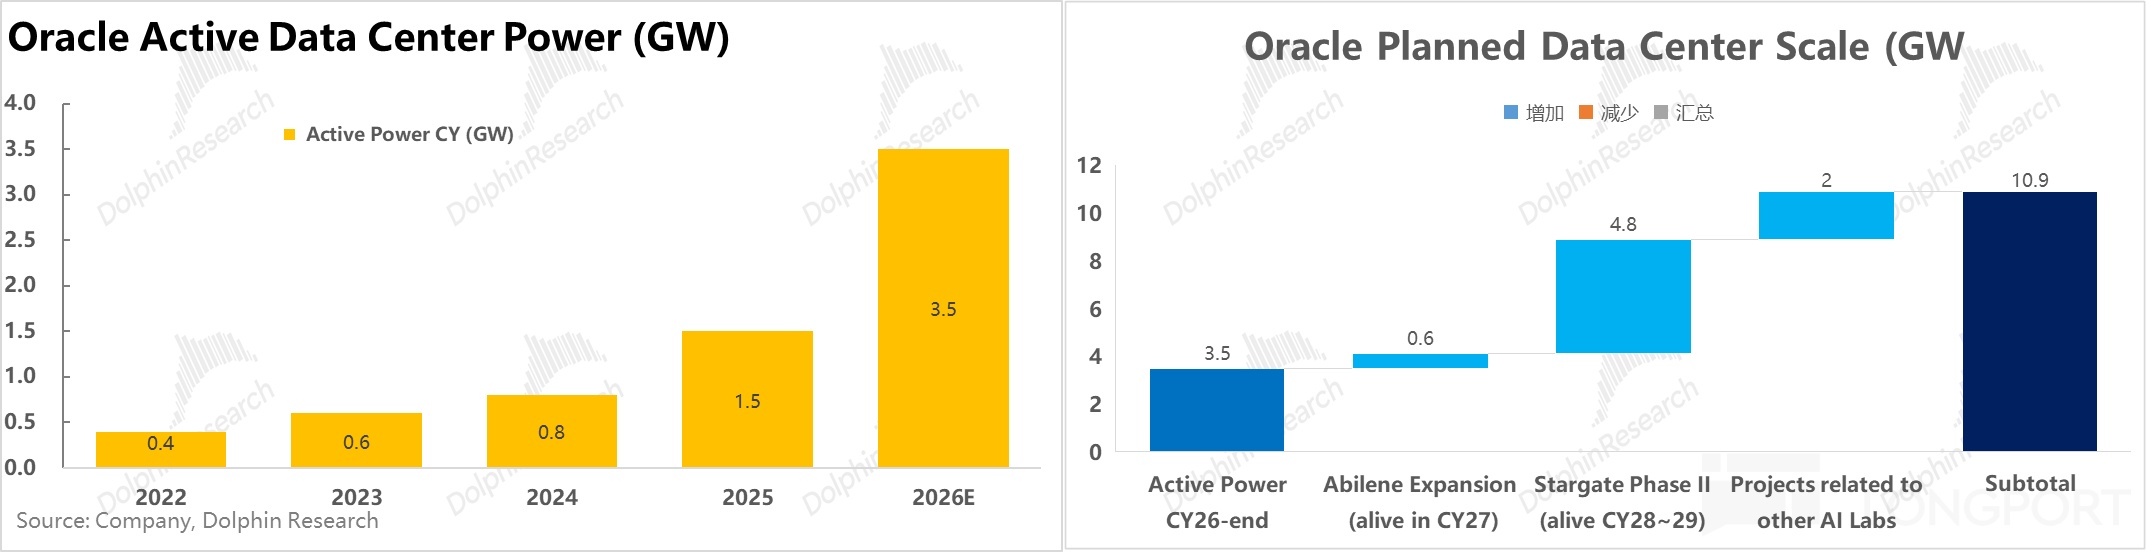
What is Oracle’s online and planned capacity today? Market trackers estimate ~3.5 GW was online by end-2026 (CY). Planned post-2026 adds are ~7.4 GW, including ~0.6 GW from the Abilene expansion, ~4.8 GW from Stargate Phase II, and ~2 GW tied to xAI, Meta and others (the latter lacks public confirmation).
All-in, planned capacity totals ~10.9 GW, supporting a Core OCI peak revenue of roughly ~$110bn. This is close to the RPO-derived peak and still shy of the $150bn FY30 target.
Another cross-check: as of F3Q26 (Feb), Oracle disclosed committed data center lease obligations of ~$261bn. Using an Avg. 17-year lease term and ~$2bn/GW/yr lease cost implies ~7.7 GW of capacity contracted but not yet utilized, broadly matching planned post-2026 additions and suggesting total commitments still fall short of the ~15 GW needed.
Across RPO, planned capacity, and committed DC leases, the triangulation converges on a similar Core OCI peak, implying an annual revenue shortfall of ~$40–50bn vs. the FY30 target. More capacity and orders are needed to close the gap.
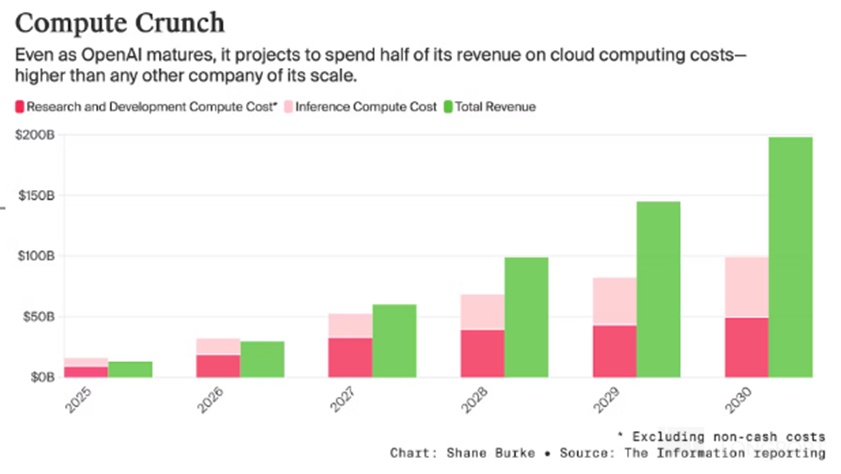
3) Method 3 — Is demand sufficient? At the end demand layer, how much compute will model providers need, and how much can end-users actually consume? Information (late 2025) projects OpenAI to reach ~$200bn revenue by 2030, with total compute spend of ~$100bn split roughly 50/50 between inference and training.
Oracle’s current OpenAI deal at ~$60bn per year would already be ~60% of OpenAI’s projected total compute spend by 2030. Unless OpenAI’s actual spend far exceeds that, Oracle likely cannot count on much more from OpenAI alone to bridge the ~$50bn gap, as over-reliance on a single vendor is implausible.
Thus, Oracle will need other large customers, such as Anthropic, to reach ~$150bn in Core OCI revenue. This aligns with our earlier supply and RPO cross-checks.
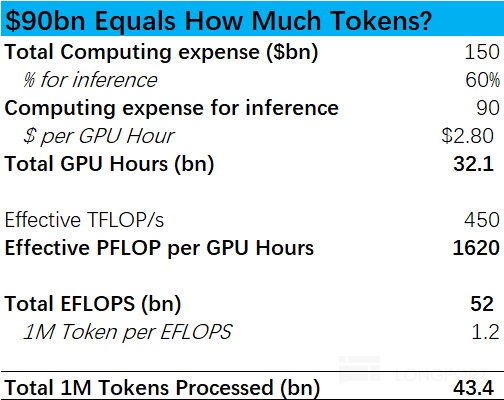
Finally, we sanity-check the FY30 target from end-user consumption. Assume 60% of the $150bn, or ~$90bn, is inference and 40% is training, as inference is more recurring while training is episodic. Translating ~$90bn inference into tokenized output suggests roughly 400–450bn 'million-token' units, based on common market assumptions (see table for the bridge, directional only).
If a light user consumes ~10 'million-token' units per year, this supports ~4bn light users. If a heavy user (e.g., Agent users) consumes ~500 units per year, this supports just ~8mn heavy users, illustrating the sensitivity to usage intensity.
And that is only for Oracle’s inference revenue; total industry demand would be 5x+ on these assumptions. Pure chatbots with light usage alone are unlikely to absorb the buildout and revenue targets, so broad-based heavy use cases are essential.
On balance, both the number of heavy users and per-user token consumption could far exceed these conservative anchors. We therefore believe total industry demand can support Oracle’s $150bn Core OCI revenue; the question is market share capture, not TAM sufficiency.
In summary, as Agents and other token-hungry workloads penetrate quickly, aggregate compute demand should easily justify hyperscaler DC expansions. The bigger issue is that Oracle’s current customers and planned capacity are not yet enough to meet its long-range revenue goal.
In other words, Oracle must secure more partners and DC suppliers to reach its targets. Execution on customer wins and capacity reservations will be critical.
III. How much profit from AI-driven revenue?
We next assess incremental profit from the above revenue path, focusing on gross margin, capex, leverage, and interest expense. These drivers determine how much of the AI revenue translates into earnings.
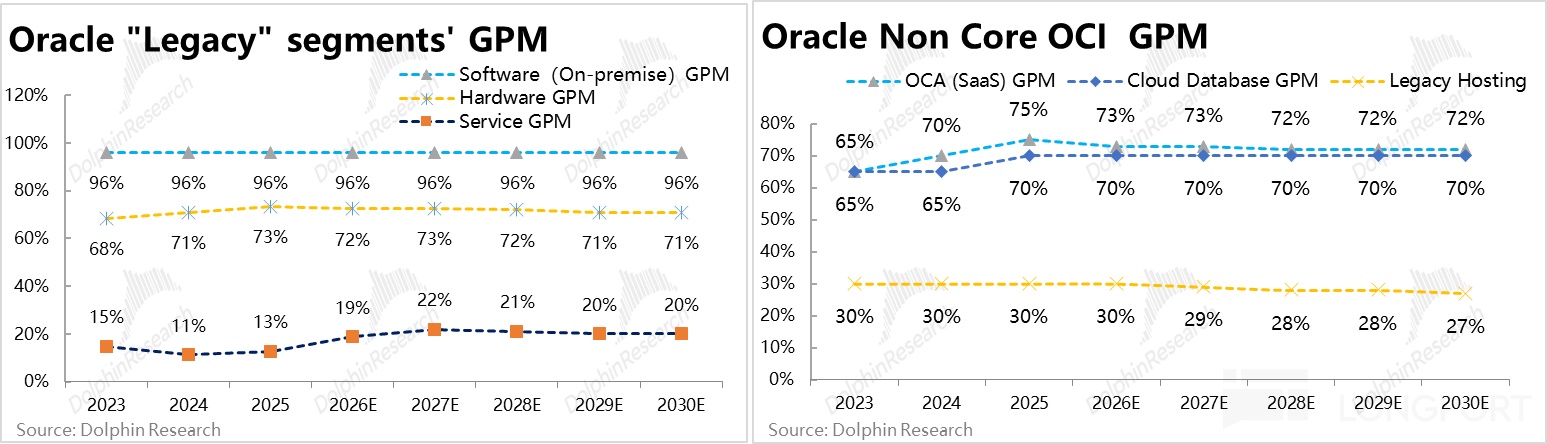
3.1 How much margin drag? To evaluate the impact of AI compute rental on consolidated GPM, we map GPM by sub-segment. Outside Core OCI, three groups emerge: a) traditional software at 90%+ GPM given near-zero marginal costs; b) OCA SaaS, Hardware, and cloud Database around ~70% GPM; and c) Legacy Hosting and Consulting at ~20%–30% GPM.
For these non-Core OCI lines, our base case assumes flat to slightly lower GPM ahead, which is more cautious than the market’s gradual uplift view. The main swing on consolidated GPM comes from mix shift toward lower-margin Core OCI and the AI sub-segment’s steady-state GPM.
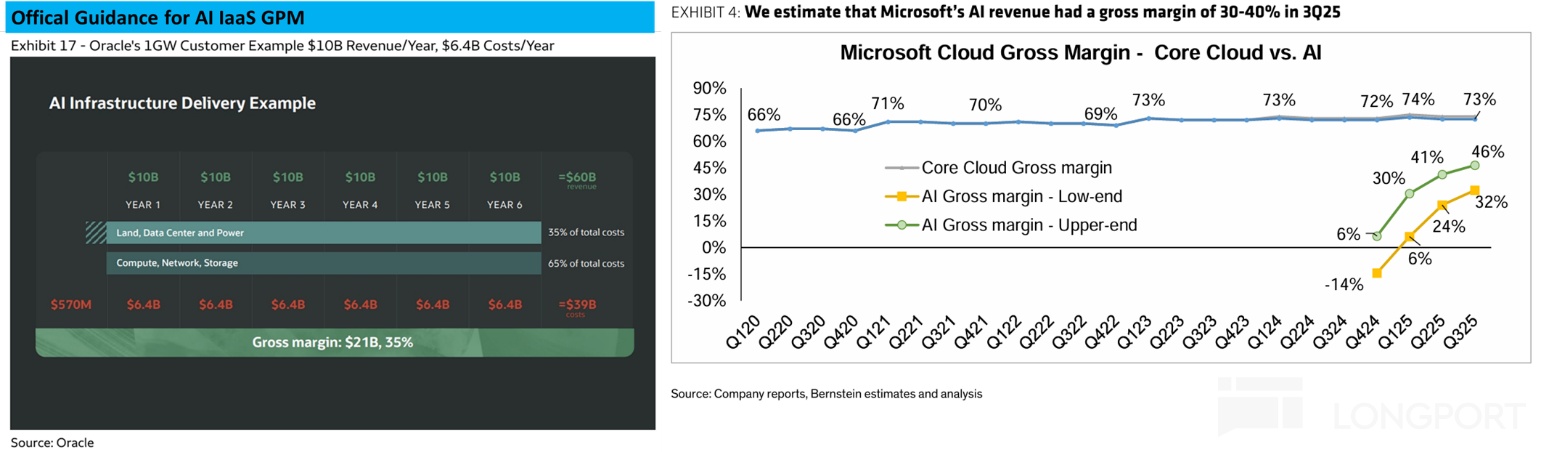
Management guides AI compute rental GPM at ~30%–35% for OCI. Is this credible? a) CoreWeave — with a similar business and cost stack — has steady-state GPM we estimate at ~25%; b) Bernstein projects MSFT’s AI cloud GPM at ~30%–40% in CY3Q25. Given Oracle’s positioning between CoreWeave and Microsoft, a ~30%–35% range looks reasonable.
Why might Oracle’s GPM exceed CoreWeave’s? Unit pricing (GPU/hour) appears slightly higher for Oracle, as implied by ~$10bn/GW/yr vs. CoreWeave’s ~$8.8bn/GW/yr. Scale advantages should also help on cost absorption and procurement.
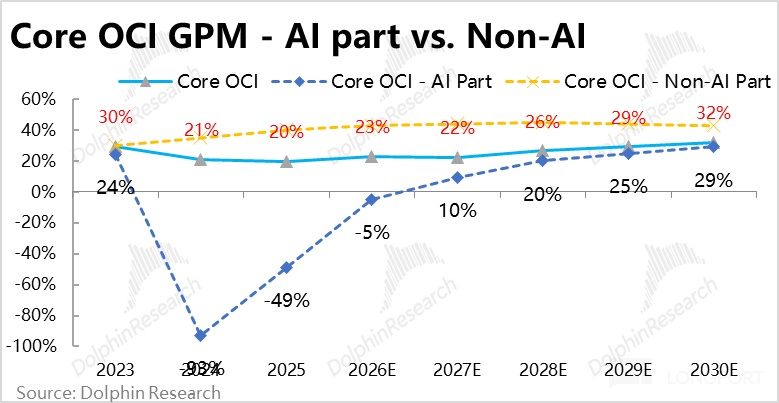
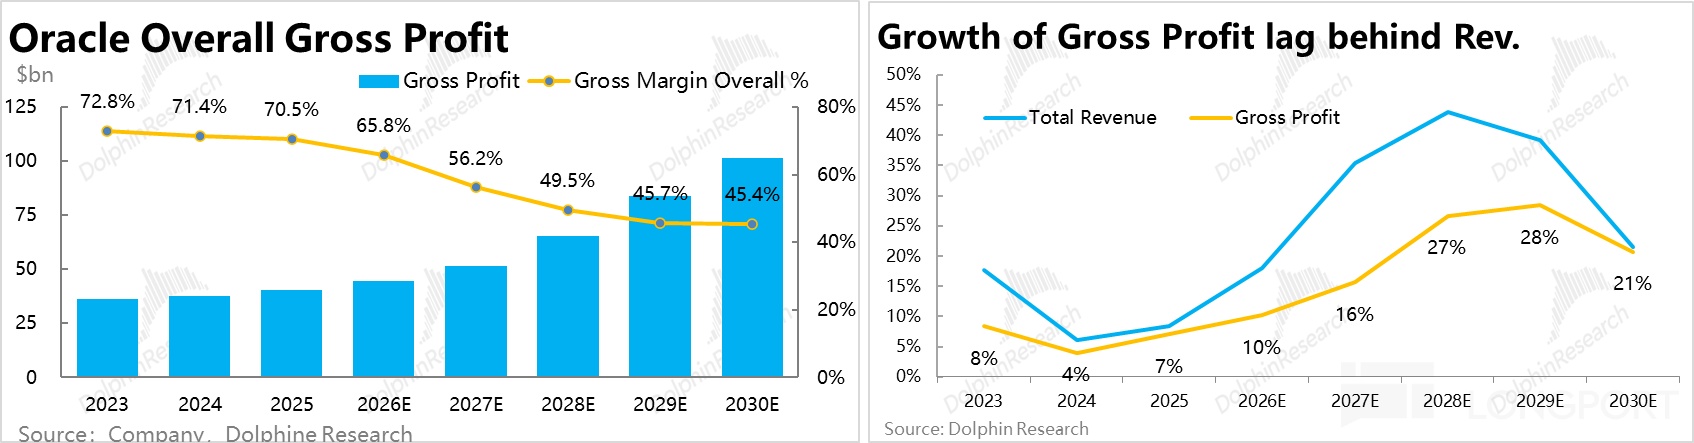
Specifically, we assume non-AI Core OCI holds just above 40% GPM, while AI turns positive in FY27 and approaches ~30% by FY30. On this basis, consolidated GPM falls from a little over 70% in FY25 to ~45% by FY30.
As a result, even though revenue accelerates in FY26–FY30 on AI, GP growth lags revenue. FY30 GP would be ~2.3x FY26 vs. revenue at ~3.3x, implying revenue growth is not fully profit-accretive.
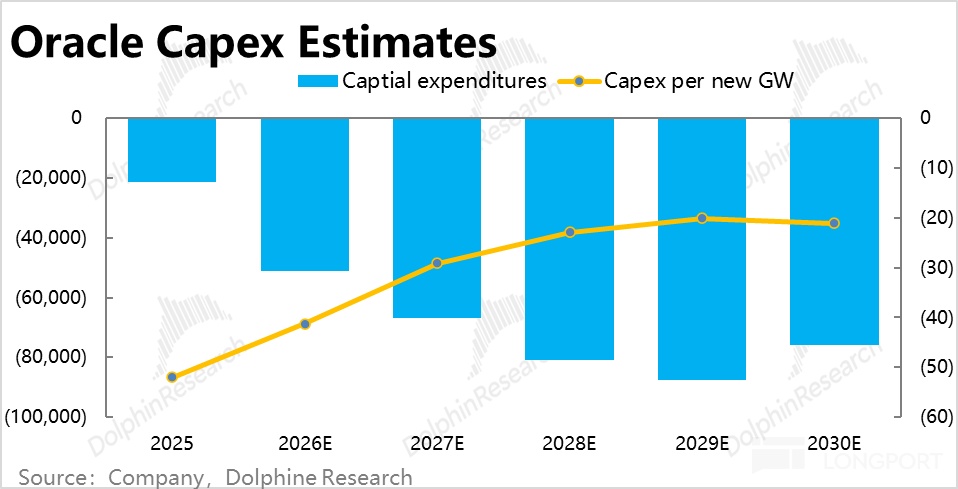
3.2 Capex, leverage, and interest Oracle previously guided capex at ~$25bn per new 1 GW compute center. This is far below Nvidia’s ~$50–60bn per GW comment, mainly because Oracle leases shell DCs from third parties rather than building its own, shifting plant/power/cooling into lease opex instead of capex.
Oracle also noted that in some projects, customer prepayments fund GPU purchases, or customers procure GPUs themselves for Oracle to operate. We therefore assume effective capex per additional GW trends lower to ~$20bn in our model.
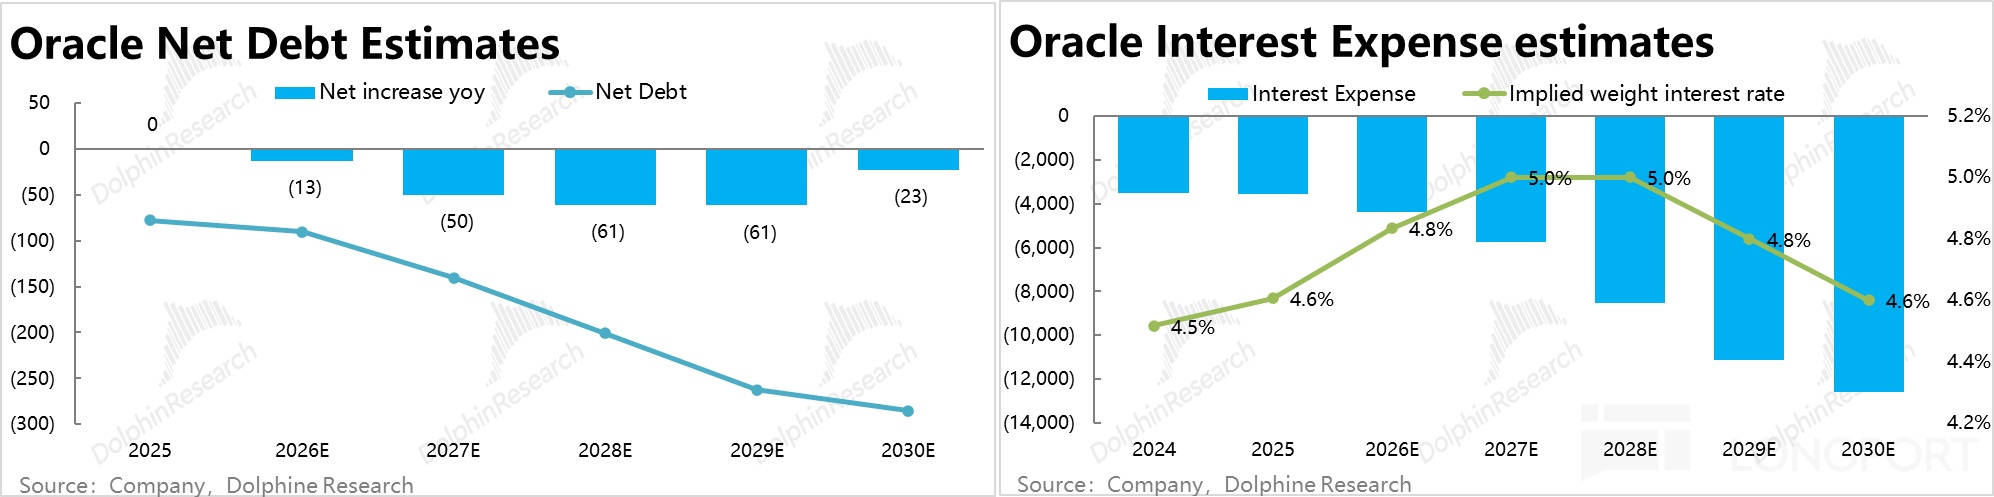
On funding, Oracle already runs net debt and tight FCF (previously used for buybacks, now for AI capex). Conservatively, we assume 70%–75% of capex in FY28–FY29 is debt-funded, dropping to ~20% in FY30 as capex peaks roll off and operating cash covers more.
We assume Avg. borrowing costs at ~4.6%–5.0% based on history and market rates. Interest expense then peaks around ~$11bn in FY30 (~5% of revenue), a key advantage over CoreWeave whose >10% borrowing costs could drive interest to ~20% of revenue and crush margins.
IV. Valuation
We value Oracle in two parts: all businesses excluding AI compute rentals (legacy trinity, OCA SaaS, and OCI non-AI compute), and the AI compute rental business alone. This split mirrors the risk/reward asymmetry between the base and the wild card.
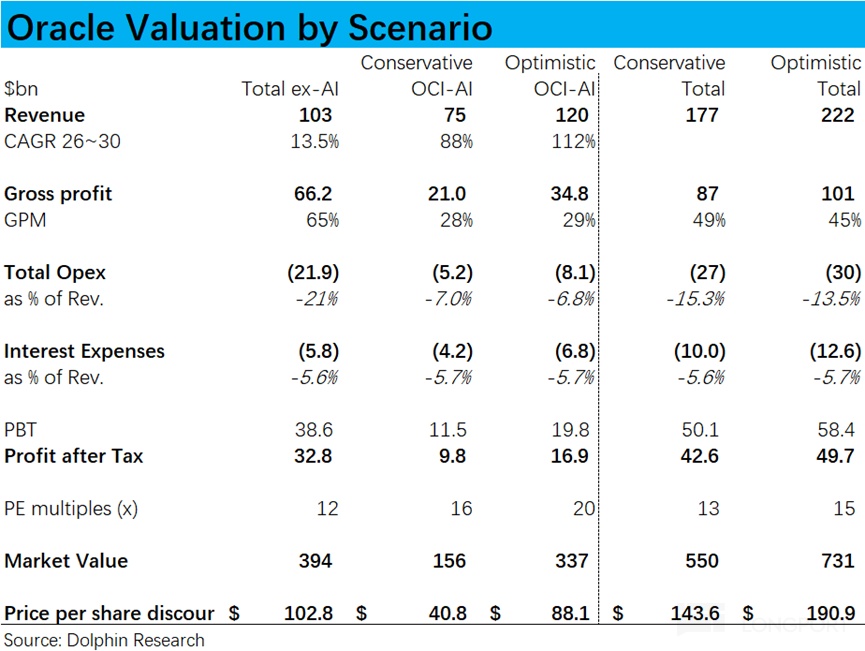
a. Ex-AI: Revenue reaches ~$103bn by FY30 (FY26–FY30 CAGR ~13.6%), with ~65% GPM. We assume flat-to-slightly-lower opex from FY26 onward, as growth slows and investment needs ease.
Under this, traditional segments deliver ~$33bn profit by FY30. Assigning 12x PE yields a DCF back to FY27 of ~$104 per share, implying ~40% downside vs. the current share price if AI is excluded.
b. AI — optimistic scenario: If total OCI nears ~$160bn by FY30 per company guide, we estimate AI contributes ~@$120bn. With AI GPM ~29% by FY30, low opex intensity (<7% of revenue) due to concentration in a few mega customers, and incremental interest per our earlier bridge, AI delivers ~$17bn after-tax profit in FY30.
At 20x PE and discounted back to FY27, that is ~$88 per share. This captures the upside from executing near the guided trajectory.
c. AI — base-to-cautious scenario: If ~@$100bn total OCI is more achievable as suggested by our cross-checks, AI revenue would be ~@$75bn. Keeping other assumptions broadly consistent and trimming PE to 16x, we get ~$9.8bn after-tax profit and ~$41 per share on a discounted basis.
Putting it together, the bear case of zero AI leaves substantial downside, but we view complete AI failure as unlikely. A more plausible risk is OpenAI losing share, forcing Oracle to re-allocate built capacity to new customers rather than writing it off, reducing tail risk.
The highest-probability path is ~@$100bn OCI revenue and ~$144 per share combined value; if shares pull back to that level, the implied annual return matches our 10% discount rate. In the optimistic case, continued AI acceleration and rising Agent workloads make the guided path — or even beats — plausible, offering further upside from mid-cycle entry points.
Risk disclosures and statements:Dolphin Research Disclaimer and General Disclosures
Recommended Articles









Comments (0)
Click the $ button, enter the symbol, and select to link a stock, ETF, or other ticker.