


Nebius Group NV Stock (NBIS) Moved Down by 9.00% on Nov 13: What Investors Need To Know


Nebius Group NV (NBIS) moved down by 9.00%. The Industrial & Commercial Services sector is up by 0.08%. The company underperformed the industry. Top 3 stocks by turnover in the sector: Nebius Group NV (NBIS) down 8.88%; Comfort Systems USA Inc (FIX) down 1.87%; PayPal Holdings Inc (PYPL) up 1.69%.
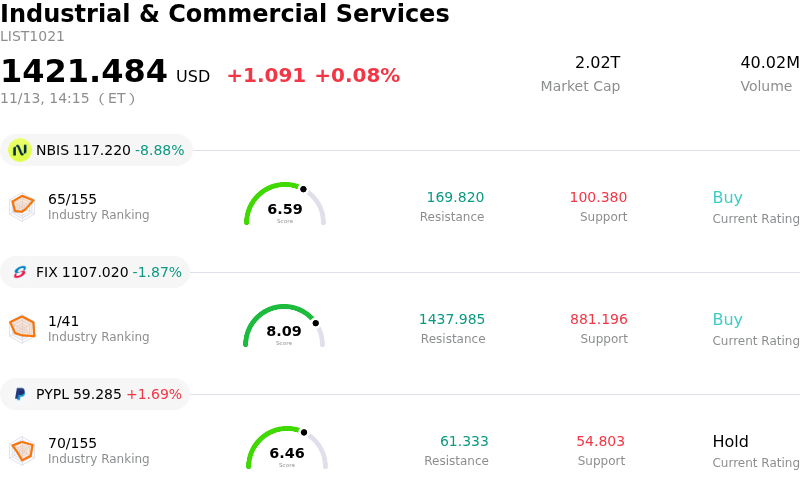
What is driving Nebius Group NV (NBIS)’s stock price down today?
Nebius Group came under considerable selling pressure during today's session as broad-based weakness across high-multiple technology equities and heightened scrutiny over capital intensity weighed heavily on the AI infrastructure sector. With institutional market participants recalibrating risk exposure amid a shifting macroeconomic backdrop, high-beta cloud infrastructure and accelerated compute providers experienced pronounced de-risking.
From a fundamental and operational standpoint, market focus has increasingly intensified around return on invested capital and the timeline for sustained free cash flow inflection. Heavy capital expenditure commitments required to secure high-performance computing hardware, scale data center footprints, and manage energy procurement continue to exert pressure on operating margins. As market expectations for rapid enterprise AI monetization meet the realities of elevated infrastructure depreciation, investors have grown increasingly sensitive to any signs of extended payback periods.
Competitive dynamics across the GPU-as-a-service landscape also contributed to the cautious sentiment. As sovereign clouds, tier-one hyperscalers, and specialized computing platforms simultaneously deploy large-scale capacity, concerns regarding mid-term pricing power and contract renewal terms have gained traction. Any perceived moderation in average contract duration or enterprise IT budget expansion prompts rapid institutional adjustments, particularly for growth assets that have seen substantial valuation appreciation.
Technical positioning and market mechanics further exacerbated the intraday downturn. Following periods of sharp trading volume and speculative momentum, the breach of key short-term moving averages triggered programmatic selling and options-related delta hedging. Institutional funds reallocating capital toward defensive cash-generative equities added additional drag to liquidity in the order book.
Looking forward, Nebius Group's trajectory will largely depend on management's ability to demonstrate durable fleet utilization rates, protect operating margins against hardware cost inflation, and secure multi-year commitments from enterprise tier-one clients. Until broader equity market volatility stabilizes and greater clarity emerges on enterprise infrastructure spending for the coming fiscal periods, the shares are likely to remain sensitive to macroeconomic crosscurrents and systematic risk reassessments.
Technical Analysis of Nebius Group NV (NBIS)
Technically, Nebius Group NV (NBIS) shows a MACD (12,26,9) value of -1.111, indicating a sell signal. The RSI at 36.208 suggests neutral condition and the Williams %R at 93.433 suggests oversold condition. Please monitor closely.
Fundamental Analysis of Nebius Group NV (NBIS)
Nebius Group NV (NBIS) is in the Industrial & Commercial Services industry. Its latest annual revenue is $529.80M, ranking 113 in the industry. The net profit is $82.50M, ranking 74 in the industry. Company Profile
Over the past month, multiple analysts have rated the company as Buy, with an average price target of $289.34, a high of $410.00, and a low of $144.00.
More details about Nebius Group NV (NBIS)
Company Specific Risks:
- Full-Year Revenue Guidance Reduction: Management lowered expectations for full-year 2026 revenue to the bottom end of its previous $3.0 billion to $3.4 billion guidance range, signaling an impending sequential revenue slowdown in the fourth quarter and triggering multiple institutional price target reductions.
- Third-Party Data Center Activation Delays: Operational delivery bottlenecks at third-party infrastructure facilities, notably in New Jersey, have forced the company to delay its projected timeline for achieving a $7 billion annualized revenue run-rate from December 2026 to February 2027, introducing new execution and capacity-fulfillment risks.
- Surging Capital Expenditure Commitments: Updated management forecasts escalated projected capital expenditures to approximately $27 billion—up sharply from the prior $20 billion to $25 billion outlook—greatly intensifying funding pressure, negative free cash flow generation, and medium-term balance sheet leverage.
- Non-Recurring Revenue Distortion: Out of the $980.8 million in reported third-quarter revenue, $325 million stemmed from non-recurring, asset-light commercial transactions rather than durable, recurring AI compute contracts, clouding the true underlying baseline and margin visibility of core operations.
This article may include AI-generated content that is human-reviewed, which is for reference and general information purposes only and does not constitute investment advice.
Recommended Articles








Comments (0)
Click the $ button, enter the symbol, and select to link a stock, ETF, or other ticker.