


Nu Holdings Ltd Stock (NU) Moved Up by 9.85% on Nov 13: A Full Analysis


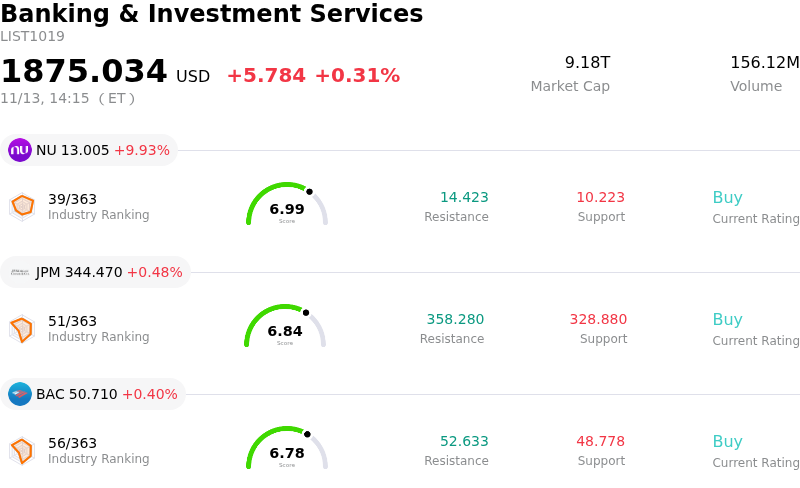
Nu Holdings Ltd (NU) moved up by 9.85%. The Banking & Investment Services sector is up by 0.31%. The company outperformed the industry. Top 3 stocks by turnover in the sector: Nu Holdings Ltd (NU) up 9.93%; JPMorgan Chase & Co (JPM) up 0.47%; Bank of America Corp (BAC) up 0.40%.
What is driving Nu Holdings Ltd (NU)’s stock price up today?
Nu Holdings advanced sharply as investors responded enthusiastically to the company's third-quarter earnings release, which demonstrated exceptional operating leverage and resilient profitability. The digital banking platform posted record quarterly net income, driven by robust top-line revenue growth across Latin America and an industry-leading return on equity. Accelerating monthly average revenue per active customer, coupled with a virtually stable low cost-to-serve, pushed the company's operating efficiency ratio to stronger levels. This powerful combination of customer monetization and unit economic efficiency reaffirmed the earnings power of the business model.
Operational execution across geographic regions provided further tailwinds for the stock. While Brazil maintained strong activity rates among its deep adult market share, newer expansion markets in Mexico and Colombia showed rapid customer acquisition and deposit accumulation, proving the portability of the low-cost digital banking infrastructure. Although investors continued to monitor rising provision expenses and delinquency indicators associated with rapid credit book growth, strong reserve coverage ratios and resilient risk-adjusted margins reassured the market that credit risks are actively managed and adequately compensated.
Market sentiment and institutional positioning significantly amplified the upward move. Ahead of the earnings announcement, shares had been compressed near 52-week lows due to broader emerging market outflows, local political uncertainties, and macroeconomic volatility in Latin America. The decisive earnings beat catalyzed short covering and institutional dip-buying, as leading sell-side analysts reiterated positive long-term ratings, distinguishing Nu Holdings as a high-margin structural compounder that trades independently of broader regional cyclical headwinds.
Technical Analysis of Nu Holdings Ltd (NU)
Technically, Nu Holdings Ltd (NU) shows a MACD (12,26,9) value of 0.139, indicating a neutral signal. The RSI at 50.363 suggests neutral condition and the Williams %R at 11.794 suggests overbought condition. Please monitor closely.
Fundamental Analysis of Nu Holdings Ltd (NU)
Nu Holdings Ltd (NU) is in the Banking & Investment Services industry. Its latest annual revenue is $15.41B, ranking 32 in the industry. The net profit is $2.87B, ranking 34 in the industry. Company Profile
Over the past month, multiple analysts have rated the company as Buy, with an average price target of $18.14, a high of $22.00, and a low of $12.00.
More details about Nu Holdings Ltd (NU)
Company Specific Risks:
- Consensus Top- and Bottom-Line Earnings Miss: In its Q3 2026 financial report, Nu Holdings missed Wall Street consensus estimates, posting adjusted earnings per share of $0.22 against the $0.23 consensus and reported revenue of $5.82 billion against the $5.91 billion expectation, triggering immediate valuation scrutiny and intraday price volatility.
- Deterioration in Asset Quality and Late-Stage Delinquencies: The bank’s 90-plus-day non-performing loan (NPL) ratio deteriorated sequentially to 7.3% from 6.9% in the prior quarter, while the 90+ delinquency rate measured against interest-earning balances increased to 12.1% from 11.6%, highlighting rising credit default risk driven by aggressive consumer lending expansion.
- Escalating Credit-Loss Provisions and Funding Costs: Expected credit-loss expenses surged to $1.67 billion for the quarter—up steeply from $0.98 billion in the year-ago period—driving total credit costs to $1.79 billion and raising analyst concerns regarding underwriting sustainability in higher-risk consumer segments.
- Sequential Operating Expense Pressure from Cost Deferrals: Management acknowledged that the quarter's 19.3% efficiency ratio was temporarily flattered by lower personnel outlays and expense shifts into the fourth quarter, indicating an impending sequential spike in operating costs compounded by upfront capital outlays for international launches.
This article may include AI-generated content that is human-reviewed, which is for reference and general information purposes only and does not constitute investment advice.
Recommended Articles








Comments (0)
Click the $ button, enter the symbol, and select to link a stock, ETF, or other ticker.