


Cloudflare Inc Stock (NET) Moved Down by 3.64% on Nov 13: Drivers Behind the Movement


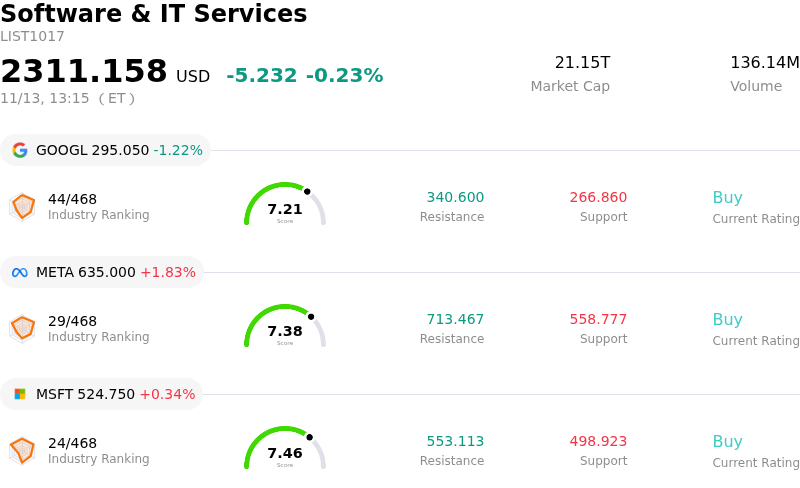
Cloudflare Inc (NET) moved down by 3.64%. The Software & IT Services sector is down by 0.23%. The company underperformed the industry. Top 3 stocks by turnover in the sector: Alphabet Inc Class A (GOOGL) down 1.22%; Meta Platforms Inc (META) up 1.83%; Microsoft Corp (MSFT) up 0.34%.
What is driving Cloudflare Inc (NET)’s stock price down today?
Cloudflare experienced downward pressure during the trading session, primarily driven by broader weakness across high-multiple enterprise software and cloud infrastructure names, compounded by valuation reassessments following the recent corporate earnings cycle. As investors continue to digest third-quarter financial results across the cloud security and edge computing space, heightened scrutiny surrounding revenue durability, customer net retention rates, and the timing of enterprise deal closures has tempered short-term sentiment. Cloudflare continues to trade at a premium valuation multiple relative to the broader software-as-a-service peer group, leaving the shares particularly sensitive to minor shifts in institutional risk appetite.
Macroeconomic crosscurrents have further exacerbated intraday volatility. Firmness in benchmark Treasury yields and persistent uncertainty surrounding the monetary policy trajectory have triggered periodic rotations away from high-beta technology assets and into more defensive or value-oriented market segments. For growth-oriented cloud platforms that reinvest heavily into global infrastructure and specialized computing capabilities, an elevated interest rate environment naturally compresses terminal valuation models. Consequently, institutional portfolio managers have demonstrated a willingness to trim exposure and rebalance risk following previous rallies.
From an operational and competitive perspective, dynamics across Secure Access Service Edge and zero-trust network architectures remain intense. Hyperscalers and established cybersecurity vendors are aggressively bundling solutions to defend their enterprise market share, placing ongoing pressure on IT budget allocations. Although Cloudflare retains substantial competitive advantages through its distributed server network, rapid developer ecosystem adoption, and edge computing innovations, market participants remain cautious regarding elongated enterprise procurement cycles and cost-optimization behaviors. Near-term share trajectory will largely depend on the company ability to sustain large customer acquisition momentum, preserve pricing discipline, and deliver measurable operating leverage.
Technical Analysis of Cloudflare Inc (NET)
Technically, Cloudflare Inc (NET) shows a MACD (12,26,9) value of 8.089, indicating a neutral signal. The RSI at 50.886 suggests neutral condition and the Williams %R at 28.613 suggests buy condition. Please monitor closely.
Fundamental Analysis of Cloudflare Inc (NET)
Cloudflare Inc (NET) is in the Software & IT Services industry. Its latest annual revenue is $2.17B, ranking 122 in the industry. The net profit is $-102.27M, ranking 536 in the industry. Company Profile
Over the past month, multiple analysts have rated the company as Buy, with an average price target of $346.54, a high of $430.00, and a low of $160.00.
More details about Cloudflare Inc (NET)
Company Specific Risks:
- Widening GAAP Operating Losses and Share Dilution: Recent quarterly financial disclosures show Cloudflare's GAAP operating loss widened to $67.9 million compared to $37.5 million in the prior-year period, with GAAP net loss expanding to $34.1 million; the persistent divergence from non-GAAP profitability underscores aggressive stock-based compensation that drives substantial ongoing equity dilution.
- Gross Margin Compression from Elevated Infrastructure Costs: Non-GAAP gross margin contracted year-over-year to 72.4% as the company absorbed elevated capital expenditures and server bandwidth overhead required to scale its distributed GPU inference clusters and edge capacity for compute-heavy agentic AI workloads.
- Extreme Valuation Multiples and Analyst Target Trims: Trading at approximately 200x forward earnings, the stock faces institutional skepticism regarding multiple sustainability, prompting research desks at firms including Scotiabank, Needham, and UBS to lower their price targets due to limited margin of safety against potential growth deceleration.
- Persistent Executive Share Liquidations: Recent SEC Form 4 filings highlighted continued divestments by core leadership, including a sale of 33,003 shares representing a 32.1% reduction in direct holdings by President Michelle Zatlyn, reinforcing institutional concerns over insider profit-taking at prevailing price levels.
This article may include AI-generated content that is human-reviewed, which is for reference and general information purposes only and does not constitute investment advice.
Recommended Articles








Comments (0)
Click the $ button, enter the symbol, and select to link a stock, ETF, or other ticker.