


Ge Vernova Inc Stock (GEV) Moved Down by 3.14% on Nov 13: Facts Behind the Movement


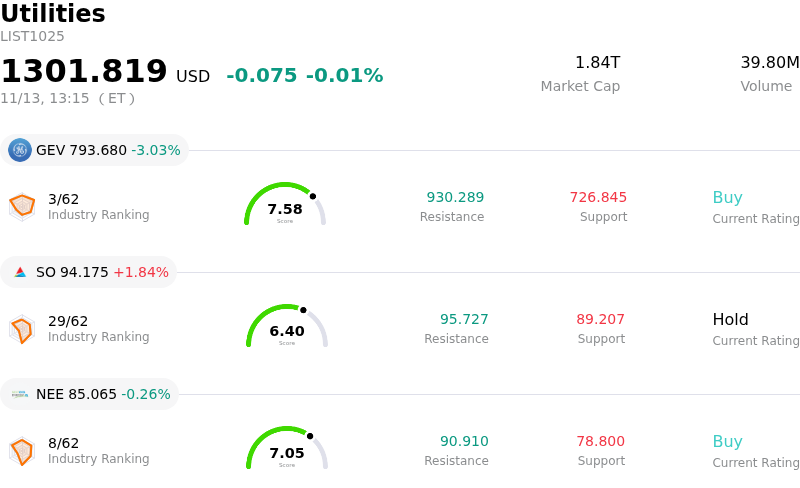
Ge Vernova Inc (GEV) moved down by 3.14%. The Utilities sector is down by 0.01%. The company underperformed the industry. Top 3 stocks by turnover in the sector: Ge Vernova Inc (GEV) down 3.12%; Southern Co (SO) up 1.84%; Nextera Energy Inc (NEE) down 0.26%.
What is driving Ge Vernova Inc (GEV)’s stock price down today?
GE Vernova experienced downward pressure during the trading session, reflecting a confluence of elevated valuation sensitivity, sector-wide capital reallocation, and persistent execution scrutiny within its renewable segment. Following an extended period of multiple expansion driven by the structural demand for power generation and data center electrification, institutional investors appeared to take profits across high-beta energy transition and electrical infrastructure names. When high-multiple momentum stocks face broader market consolidation, risk-off sentiment frequently triggers amplified pullbacks as market participants de-risk positions.
A key factor influencing investor sentiment remains the operational bifurcation within the company's core operating segments. While the Power and Electrification divisions continue to benefit from robust commercial turbine demand, higher pricing power, and expanding multi-year order backlogs, the Wind business continues to be viewed through a more cautious lens. Persistent supply chain bottlenecks, installation timelines, and elevated legacy contract execution risks in offshore wind have kept market participants attentive to near-term margin volatility. Any perceived delay in achieving targeted margin recovery across offshore commitments tends to weigh disproportionately on near-term multiples.
Macroeconomic cross-currents and capital cost expectations also played a noticeable role in dampening market enthusiasm. With sovereign bond yields hovering at elevated levels, utility developers and independent power producers face ongoing financing discipline. Because utility-scale grid modernization, gas turbine capacity additions, and large-scale renewable generation require substantial front-loaded capital expenditures, shifts in rate expectations can trigger tactical adjustments to project timelines and order intake pacing across industrial equipment providers.
From an institutional portfolio perspective, trading flows pointed toward tactical rotation away from year-to-date industrial outperformers into more defensive pockets of the market. After substantial appreciation that priced in significant long-term growth from electrification tailwinds, the stock has become increasingly sensitive to broader index volatility and factor-based momentum unwinds. Despite the intraday retreat, GE Vernova's fundamental medium-term investment thesis remains supported by rising global electricity demand and robust grid modernization backlogs, though near-term price discovery will likely hinge on operational execution and evidence of sustained profitability in the renewables division.
Technical Analysis of Ge Vernova Inc (GEV)
Technically, Ge Vernova Inc (GEV) shows a MACD (12,26,9) value of -5.512, indicating a sell signal. The RSI at 40.478 suggests neutral condition and the Williams %R at 74.709 suggests sell condition. Please monitor closely.
Media Coverage of Ge Vernova Inc (GEV)
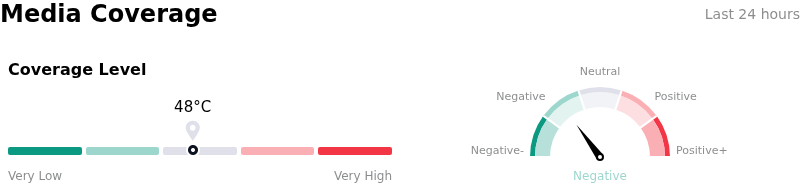
In terms of media coverage, Ge Vernova Inc (GEV) shows a coverage score of 48, indicating a moderate level of media attention. The overall market sentiment index is currently in bearish zone.
Fundamental Analysis of Ge Vernova Inc (GEV)
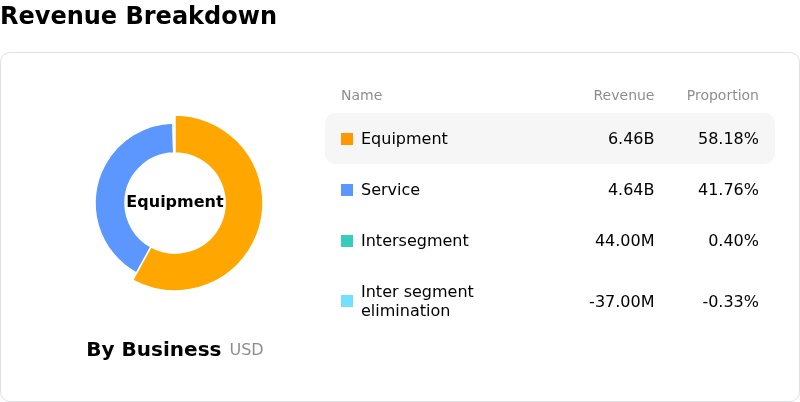
Ge Vernova Inc (GEV) is in the Utilities industry. Its latest annual revenue is $38.07B, ranking 2 in the industry. The net profit is $4.88B, ranking 4 in the industry. Company Profile
Over the past month, multiple analysts have rated the company as Buy, with an average price target of $1151.40, a high of $1400.00, and a low of $540.00.
More details about Ge Vernova Inc (GEV)
Company Specific Risks:
- Data Center Turbine Order and Counterparty Risk: Market volatility has surged due to heightened scrutiny over gas turbine commitments to artificial intelligence data centers (which represent roughly 20% of GEV's gas power backlog) following SoftBank's $3.7 billion power-equipment charge for its Ohio data center campus and market rumors regarding prospective equipment order defaults.
- Persistent Wind Segment Losses and Project Execution Overhang: The Wind division remains an ongoing margin headwind, with management maintaining an expected annual EBITDA loss of $400 million to $500 million due to persistent installation friction, supply chain bottlenecks, and contract cost overruns on complex North Sea offshore projects that will persist through 2027.
- Cash Flow Vulnerability to Customer Advance Normalization: Analysts have raised concerns over the underlying quality of reported free cash flow, as customer advances and working capital accounted for $5.3 billion of the reported $5.4 billion quarterly cash generation; any slowdown in new slot reservations or deferrals by project developers poses an immediate risk of sharp cash flow compression.
- Electrification Order Contraction and Multiple De-Rating: Despite headline power generation expansion, underlying Electrification division orders declined 9%, signaling uneven execution across operating divisions; this divergence has triggered analyst price target trims and multiple compression from historically elevated valuation levels during broader infrastructure pullbacks.
This article may include AI-generated content that is human-reviewed, which is for reference and general information purposes only and does not constitute investment advice.
Recommended Articles








Comments (0)
Click the $ button, enter the symbol, and select to link a stock, ETF, or other ticker.