


Ethereum (ETHUSD) Suddenly Goes up 1.13% on Nov 2: What You Need to Watch


Ethereum (ETHUSD) is up 1.13% at Nov 2 20:15(ET), now at $2286.75, with a 7-day down of 0.75%.
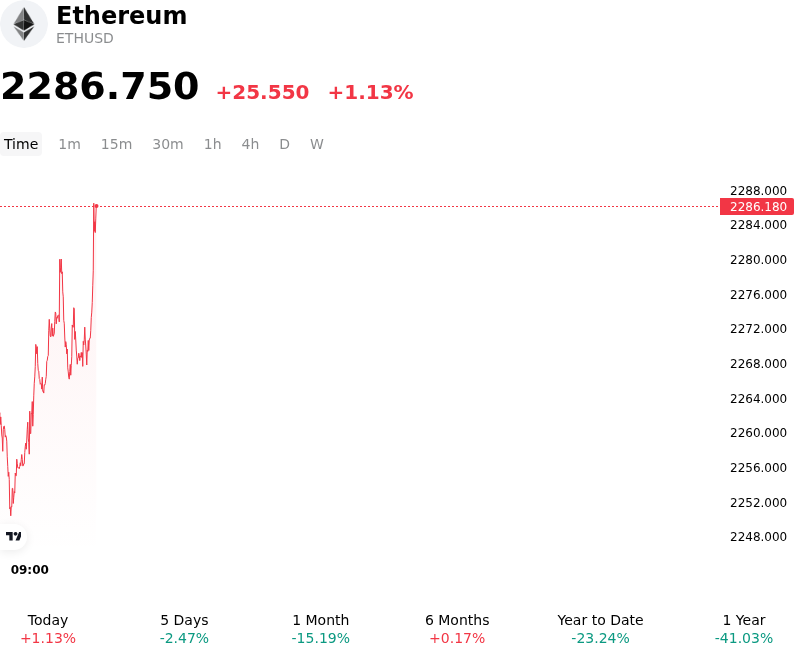
What is driving Ethereum (ETHUSD)’s stock price up today?
Capital inflows into Ethereum were driven by a recovery in market sentiment and the easing of systemic liquidity constraints across major trading venues. A primary catalyst was the full restoration of withdrawal operations for Ether and major stablecoins on key exchanges following late-October security disruptions, which released constrained capital and normalized order book liquidity. The resolution of these exchange-level operational bottlenecks removed a major overhang of counterparty risk, encouraging institutional trading desks and market makers to re-engage in arbitrage and spot capital deployment.
From a technical and market structure perspective, the advance was propelled by short covering and mean-reversion buying near key support levels. Ether had tested technical support around its long-term moving averages after absorbing heavy institutional selling pressure, marked by three consecutive weeks of net redemptions from US spot Ethereum ETFs. As daily ETF outflows began to stabilize and relentless sell-side pressure abated, derivatives positioning shifted, prompting short-covering in perpetual futures and derivatives markets that accelerated the intraday price recovery.
Market sentiment was further supported by structural ecosystem factors and upcoming network milestones. Investors increasingly focused on core development catalysts, including the opening of the Devcon developer conference in Mumbai, progress surrounding the Glamsterdam network upgrade, and proposed adjustments to token issuance and staking yields. While broader macroeconomic conditions, Federal Reserve monetary policy expectations, and US Dollar movements remain critical variables, the immediate price action reflected a technical and liquidity-driven stabilization as institutional capital re-entered after an oversold stretch.
Technical Analysis of Ethereum (ETHUSD)
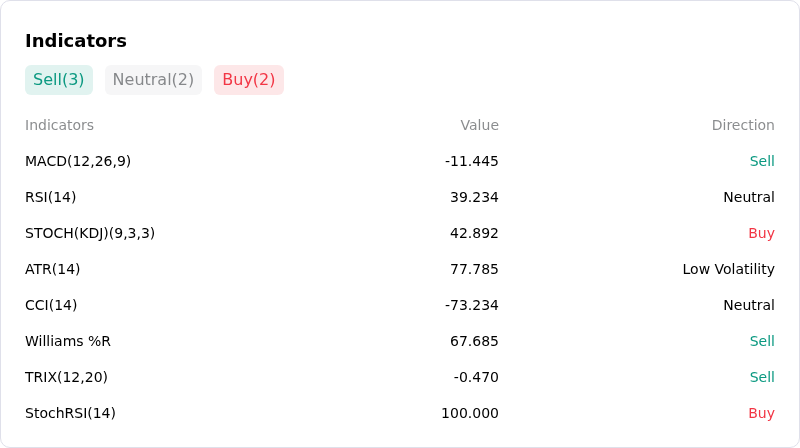
Technically, Ethereum (ETHUSD) shows a MACD (12,26,9) value of -11.445, indicating a sell signal. The RSI at 39.234 suggests neutral condition and the Williams %R at 67.685 suggests sell condition. Please monitor closely.
More details about Ethereum (ETHUSD)
Recent Events and Risks:
- Record Spot ETF Outflows: U.S. spot Ethereum ETFs experienced severe net redemptions exceeding $1.6 billion throughout October, including single-day outflows surpassing $105 million, stripping away institutional buying support and forcing asset managers to deposit tens of thousands of ETH to exchanges for liquidation.
- Whale Distribution and Exchange Inflows: On-chain tracking reveals aggressive whale distribution, with large wallet holders offloading over 160,000 ETH while central exchange reserves increased by more than 100,000 ETH, placing substantial sell-side inventory directly onto order books.
- Forced Long Liquidations and Leverage Deleveraging: The breakdown below key support levels triggered tens of millions in forced long liquidations across major derivatives venues like Binance, Bybit, and OKX, leaving remaining multi-million dollar leveraged long positions exposed to further forced unwinds if lower thresholds are breached.
- Technical Support Failure and Pattern Breakdown: Ethereum lost crucial technical support around $2,385, completing a breakdown from a daily chart formation that opens immediate downside risk toward lower demand zones near $2,000 as taker sell orders dominate futures volume.
This article may include AI-generated content that is human-reviewed, which is for reference and general information purposes only and does not constitute investment advice.
Recommended Articles








Comments (0)
Click the $ button, enter the symbol, and select to link a stock, ETF, or other ticker.