


Banco Santander SA Stock (SAN) Closed Down by 4.77% on Oct 30: Key Drivers Unveiled


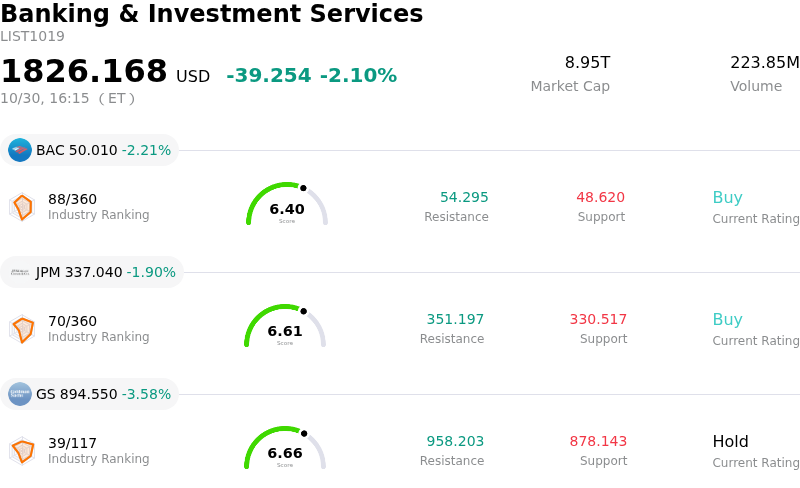
Banco Santander SA (SAN) closed down by 4.77%. The Banking & Investment Services sector is down by 2.10%. The company underperformed the industry. Top 3 stocks by turnover in the sector: Bank of America Corp (BAC) down 2.21%; JPMorgan Chase & Co (JPM) down 1.90%; Goldman Sachs Group Inc (GS) down 3.58%.
What is driving Banco Santander SA (SAN)’s stock price down today?
Banco Santander experienced selling pressure following the release of its third-quarter financial results. Although the banking group delivered solid underlying profit growth, top-line quarterly revenue fell short of consensus expectations due to softer-than-projected net interest income and fee income. Market sentiment was further dampened by a decline in reported attributable net profit, which was dragged down by substantial integration charges and asset impairment costs tied to its strategic acquisitions of Webster Financial in the United States and TSB in the United Kingdom.
Compounding revenue concerns, profitability was strained by an uptick in net loan-loss provisions that surpassed analyst forecasts. The higher credit loss reserves reflect ongoing macroeconomic volatility and credit risk exposure across key emerging markets, particularly in Latin America. Political developments and interest rate uncertainty in Brazil, which accounts for a significant portion of the group's net income, have heightened investor anxiety regarding potential net interest margin compression and asset quality erosion in South American operations.
Additional pressure stems from capital allocation concerns and technical factors. Investors digested filings outlining a long-term shift in the bank's remuneration framework, which lowers the baseline cash dividend allocation in favor of share buybacks, introducing greater reliance on market execution and regulatory approvals. On the charts, the stock's breakdown below key short- and medium-term moving averages triggered systematic selling and momentum-based liquidations, amplified by analyst rating downgrades across the sector.
Technical Analysis of Banco Santander SA (SAN)
Technically, Banco Santander SA (SAN) shows a MACD (12,26,9) value of -0.345, indicating a sell signal. The RSI at 21.126 suggests sell condition and the Williams %R at 97.323 suggests oversold condition. Please monitor closely.
Fundamental Analysis of Banco Santander SA (SAN)
Banco Santander SA (SAN) is in the Banking & Investment Services industry. Its latest annual revenue is $65.95B, ranking 5 in the industry. The net profit is $15.90B, ranking 5 in the industry. Company Profile
Over the past month, multiple analysts have rated the company as Buy, with an average price target of $14.78, a high of $15.70, and a low of $13.86.
More details about Banco Santander SA (SAN)
Company Specific Risks:
- Earnings Pressure from Integration Costs and Impairments: Banco Santander reported lower sequential net profit in its third-quarter earnings update, burdened by elevated integration expenses, intangible asset impairments, and increased loan-loss provisions.
- Underperformance in Brazilian Subsidiary: The bank's Brazilian unit emerged as a major operational weak spot during the recent Q3 earnings report, compounding investor fears regarding Latin American credit quality and regional economic policy uncertainty.
- Analyst Downgrades Following Revenue Miss: Analysts at Erste Group Bank downgraded SAN from a Buy to a Hold rating on October 30, pointing to constrained earnings growth after third-quarter revenue fell short of Wall Street forecasts.
- Emerging Legal and Disclosure Investigations: Investor rights law firms launched class action investigations regarding potential misleading disclosures following back-to-back stock sell-offs tied to unexpected integration costs and deteriorating international operating metrics.
This article may include AI-generated content that is human-reviewed, which is for reference and general information purposes only and does not constitute investment advice.
Recommended Articles








Comments (0)
Click the $ button, enter the symbol, and select to link a stock, ETF, or other ticker.