


Platinum (XPTUSD) Volatility Intensified on Oct 30: What to Watch



Platinum (XPTUSD) is down 2.06% at Oct 30 23:15(ET), now at $1455.86, with a 7-day down of 6.17%.
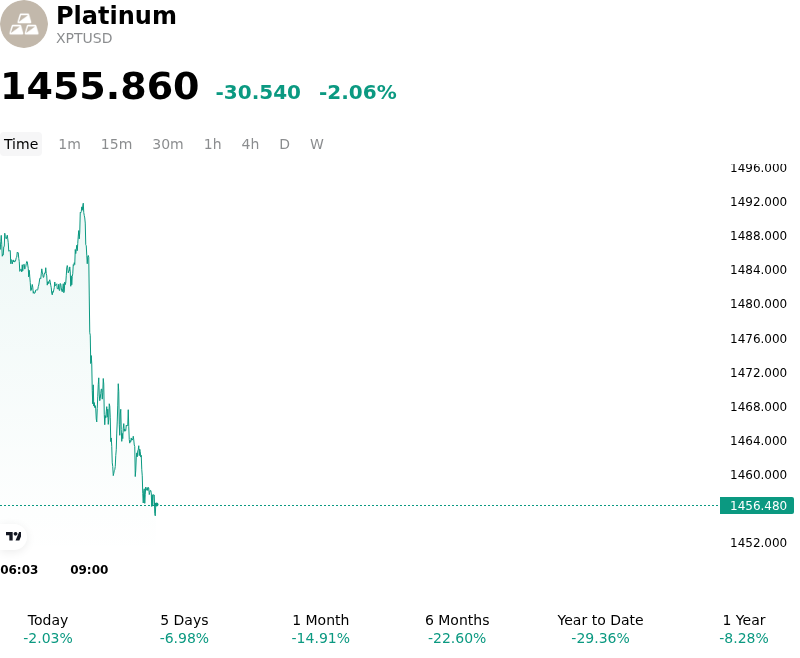
What is driving Platinum (XPTUSD)’s stock price down today?
The downward movement in spot platinum was primarily driven by a combination of tight macroeconomic conditions, shifting physical market balances, and technical selling pressure across the precious metals complex. Restrictive monetary policy expectations from the Federal Reserve, coupled with elevated U.S. Treasury yields, continued to increase the opportunity cost of holding non-yielding precious metals. The resulting firm backdrop for the U.S. dollar further curtailed international buying interest, applying broad-based downward pressure on dollar-denominated commodities.
From a fundamental supply-demand perspective, investor sentiment has been tempered by expectations of an easing global market balance. After consecutive years of structural deficits, the platinum market faces near-term headwind shifts toward a modest surplus. Weakening demand in the automotive sector, driven by auto catalyst thrifting and sluggish vehicle production growth, has been compounded by soft consumer demand for platinum jewelry in key Asian markets. Furthermore, continued outflows from exchange-traded funds and net institutional disinvestment have reduced physical demand absorption, offsetting structural supply constraints in major mining regions like South Africa while secondary supply from recycling continues to recover.
Technical factors significantly amplified the intraday decline. The price action breached critical psychological and technical support levels around the $1,500 per troy ounce threshold, triggering automated stop-loss orders and systematic trend-following selling. While long-term structural tailwinds from green hydrogen infrastructure and industrial applications remain intact, short-term institutional capital flows remain cautious until macroeconomic clarity improves and physical demand shows signs of stabilization.
Technical Analysis of Platinum (XPTUSD)
Technically, Platinum (XPTUSD) shows a MACD (12,26,9) value of -25.951, indicating a sell signal. The RSI at 26.170 suggests sell condition and the Williams %R at 99.251 suggests oversold condition. Please monitor closely.
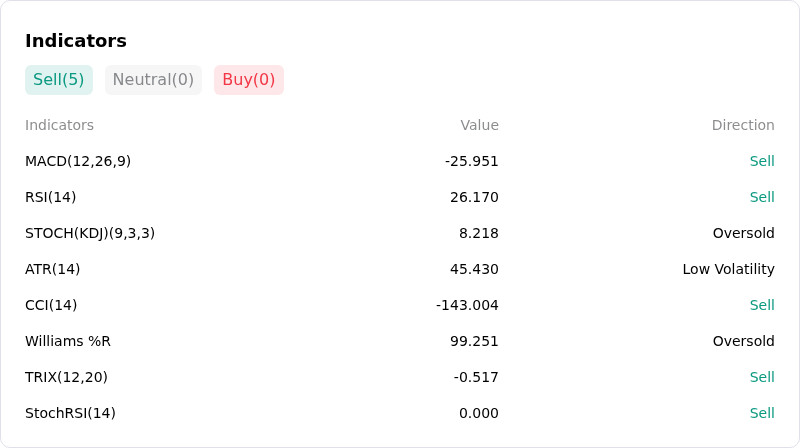
More details about Platinum (XPTUSD)
Recent Events and Risks:
- Market Transition to Annual Surplus: Updated supply-demand projections from the World Platinum Investment Council (WPIC) confirming a 265,000-ounce surplus for 2026—reversing years of structural supply deficits—have triggered heavy institutional de-risking and systematic selling across XPTUSD.
- Weakening Automotive Autocatalyst Consumption: Decelerating global light-vehicle production and expanding market penetration of zero-emission battery electric vehicles (BEVs) continue to erode catalytic converter metal usage, driving expected 2026 automotive platinum demand down by 4%.
- Macroeconomic Headwinds from Yields and Dollar Strength: Elevated U.S. real benchmark yields alongside a resilient U.S. dollar have substantially increased the opportunity cost of holding non-yielding precious metals, subjecting spot platinum to macro risk-off flows and technical breakdown below key moving averages.
- Contraction in Asian Physical and Jewelry Demand: High price sensitivity and cautious consumer spending across major Asian end-markets have weakened physical spot support, marked by a 15% year-over-year contraction in Chinese platinum jewelry consumption.
This article may include AI-generated content that is human-reviewed, which is for reference and general information purposes only and does not constitute investment advice.
Recommended Articles









Comments (0)
Click the $ button, enter the symbol, and select to link a stock, ETF, or other ticker.