


Solana (SOLUSD) Is down 1.97% on Oct 30: What Do On-Chain Data and Market Sentiment Show?



Solana (SOLUSD) is down 1.97% at Oct 30 20:20(ET), now at $93.3, with a 7-day down of 9.34%.
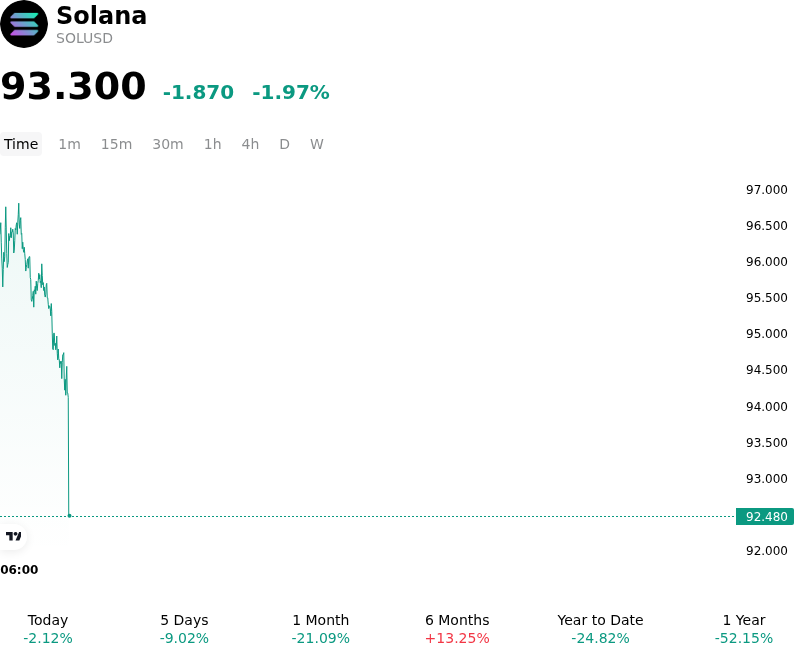
What is driving Solana (SOLUSD)’s stock price down today?
Solana faced downside pressure as persistent redemptions from spot Solana exchange-traded funds weakened institutional spot demand and weighed heavily on broad market sentiment. Following weeks of sustained outflows throughout October, capital withdrawals from spot ETF products continued to remove a vital structural bid for the asset. This ongoing liquidity drain highlighted softer institutional appetite for alternative digital assets relative to Bitcoin, dampening expectations for immediate spot price stabilization.
The decline was further compounded by broader crypto market risk-off behavior and derivatives deleveraging. Exogenous market shocks and security concerns surrounding major centralized trading venues triggered elevated volatility across top altcoins. Because Solana maintains highly active derivatives markets and concentrated exchange liquidity, the sudden shift in overall risk appetite prompted a wave of forced long liquidations, accelerating short-term downward price momentum.
On-chain capital flows and technical breakdowns added further selling pressure. Large token transfers and distribution from major wallet holders increased spot order book supply at a time when decentralized exchange volumes and total value locked across the ecosystem experienced temporary pullbacks. From a technical perspective, the asset's failure to hold key moving averages and its test of critical psychological support around the hundred-dollar mark triggered stop-loss executions among short-term systematic traders.
While long-term fundamental drivers such as stablecoin expansion, institutional staking integration, and enterprise network deployment continue to build structural network utility, near-term price action remains constrained by macro liquidity conditions and altcoin capital rotation. Institutional investors continue to monitor spot ETF flow stabilization, overall market leverage, and broader risk sentiment as primary indicators for a potential trend reversal.
Technical Analysis of Solana (SOLUSD)
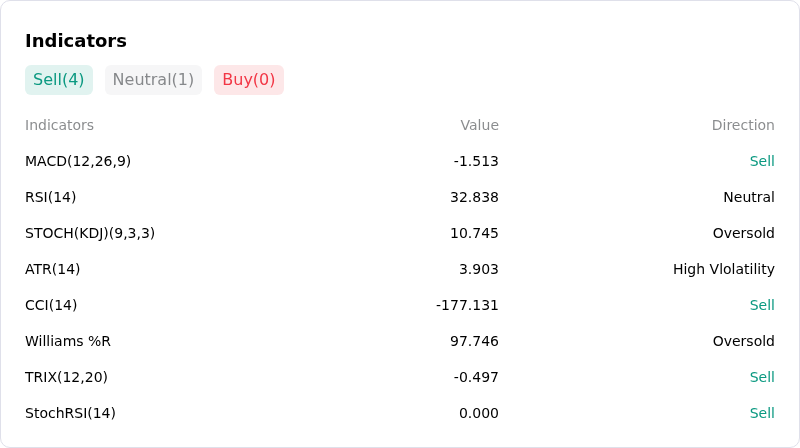
Technically, Solana (SOLUSD) shows a MACD (12,26,9) value of -1.513, indicating a sell signal. The RSI at 32.838 suggests neutral condition and the Williams %R at 97.746 suggests oversold condition. Please monitor closely.
More details about Solana (SOLUSD)
Recent Events and Risks:
- Contagion From Exchange Security Incident and Liquidations: Market-wide distress triggered by a major security incident at Binance forced over $600 million in leveraged long liquidations across crypto markets, pulling SOL down sharply due to thin altcoin order book liquidity and correlated selling across primary trading pairs.
- Accelerating Institutional Spot ETF Outflows: Institutional demand via U.S. spot Solana ETFs continues to weaken, recording daily net redemptions of $19.16 million and bringing total monthly outflows near $100 million, removing a major source of sustained buy-side market support.
- Contraction in On-Chain TVL and DEX Activity: On-chain network activity and liquidity metrics show deteriorating fundamentals, highlighted by a 10% drop in Solana total value locked (TVL), a 24% decline in decentralized exchange (DEX) trading volume, and shrinking stablecoin market cap.
- Technical Support Breakdown and Downside Liquidation Squeeze: SOL's loss of the key $100 psychological level and retest of support near $98.50 confirms a daily head-and-shoulders breakdown pattern, elevating the risk of leveraged unwind cascades toward secondary support zones between $80 and $88.
This article may include AI-generated content that is human-reviewed, which is for reference and general information purposes only and does not constitute investment advice.
Recommended Articles









Comments (0)
Click the $ button, enter the symbol, and select to link a stock, ETF, or other ticker.