


WTI (USOIL) Is down 2.01% on Oct 26: What You Need to Watch



WTI (USOIL) is down 2.01% at Oct 26 21:25(ET), now at $101.11, with a 7-day up of 2.99%.
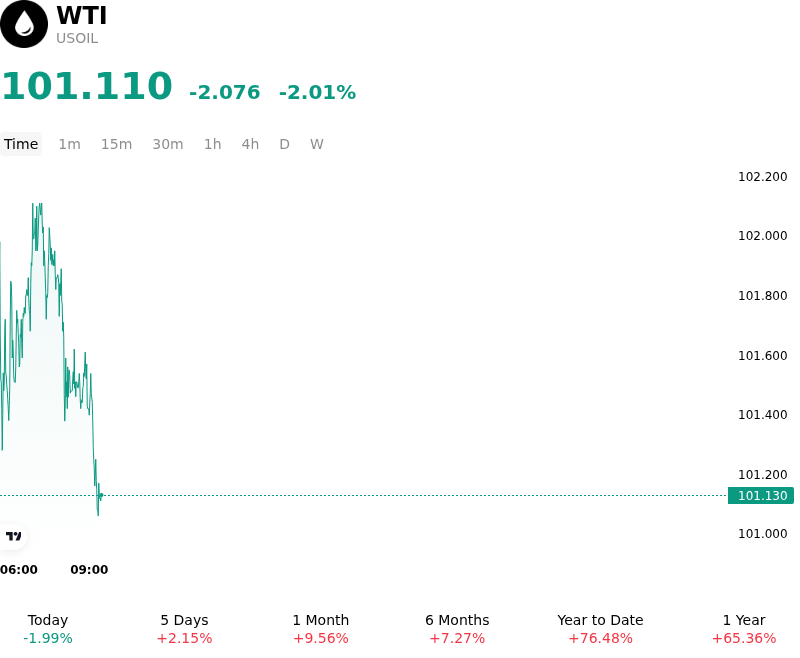
What is driving WTI (USOIL)’s stock price down today?
West Texas Intermediate crude oil experienced a downward retracement as market participants engaged in profit-taking following a strong multi-session rally. The sell-off was primarily driven by a partial unwinding of the geopolitical risk premium that had previously built up amid escalating Middle East tensions involving the United States, Israel, and Iran. Although geopolitical headlines continued to keep energy markets on edge, the lack of immediate, direct disruptions to physical crude infrastructure or maritime shipping lanes through the Strait of Hormuz prompted institutional investors to take profits and liquidate tactical long positions.
From a fundamental supply and demand perspective, the physical crude market continues to demonstrate near-term balance. Global crude production outside OPEC+ remains robust, providing a buffer against prospective regional supply shocks. While market participants remain sensitive to potential military developments, current physical oil flows continue to reach international refiners without operational interruptions. The absence of tangible supply losses has capped immediate upside momentum, shifting focus back toward broader physical balance metrics and inventory trajectory.
Macroeconomic conditions and currency fluctuations also contributed to the downward pressure on crude prices. A resilient U.S. dollar made dollar-denominated commodities relatively more expensive for international buyers, dampening prompt import interest. Simultaneously, broader financial market caution regarding global industrial activity and central bank policy pathways served as a headwind for energy demand expectations. Institutional capital flows reflected this shift, as systematic funds adjusted leverage to mitigate risk amid heightened price volatility.
Overall, the decline in oil prices reflects a temporary, event-driven repricing rather than a fundamental structural breakdown in global energy fundamentals. The market remains caught between supportive supply-side geopolitical risk premiums and counterbalancing macroeconomic demand concerns. Institutional traders will continue to closely monitor Middle East security developments, upcoming U.S. inventory reports, and OPEC+ policy signals for clarity on the next directional catalyst.
Technical Analysis of WTI (USOIL)
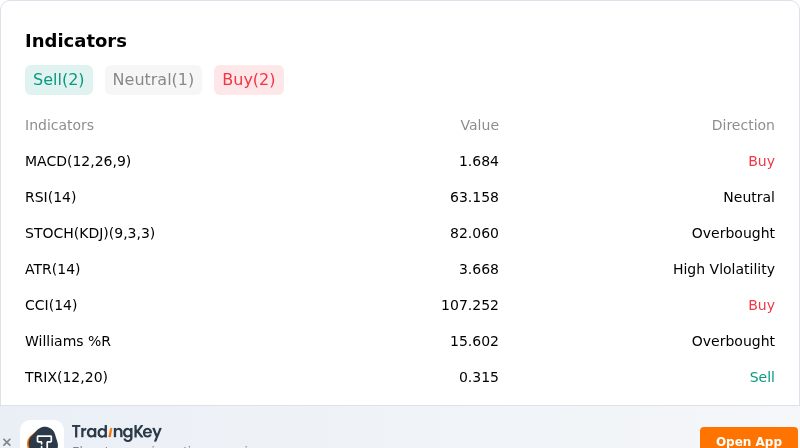
Technically, WTI (USOIL) shows a MACD (12,26,9) value of 1.684, indicating a buy signal. The RSI at 63.158 suggests neutral condition and the Williams %R at 15.602 suggests overbought condition. Please monitor closely.
More details about WTI (USOIL)
Recent Events and Risks:
- Geopolitical Risk Premium De-escalation: News surrounding potential diplomatic mediation and temporary lulls in maritime security threats have prompted immediate profit-taking, causing traders to unwind accumulated geopolitical risk premiums and driving WTI futures lower from multi-month highs.
- US Sanctions Waivers and Fleet Regulatory Relief: Policy shifts and executive actions waiving sanctions on energy exports alongside proposed regulatory relief for oil tankers threaten to expand effective seaborne crude transport capacity, applying downward pressure to futures prices.
- IEA Demand Growth Downgrades: Major international energy agencies and institutional strategists have downgraded global oil consumption forecasts, citing persistent macroeconomic headwinds and high fuel costs that are driving demand destruction across key industrial sectors.
- Technical Overhead Resistance and Long Position Unwinding: Futures encountered sharp technical resistance near psychological threshold levels, triggering automated stop-loss selling and position unwinding as momentum indicators reached overbought territory.
This article may include AI-generated content that is human-reviewed, which is for reference and general information purposes only and does not constitute investment advice.
Recommended Articles











Comments (0)
Click the $ button, enter the symbol, and select to link a stock, ETF, or other ticker.