


Ethereum (ETHUSD) Is down 1.03% on Oct 26: What Are the Risk Factors?



Ethereum (ETHUSD) is down 1.03% at Oct 26 20:50(ET), now at $2320.74, with a 7-day down of 3.25%.
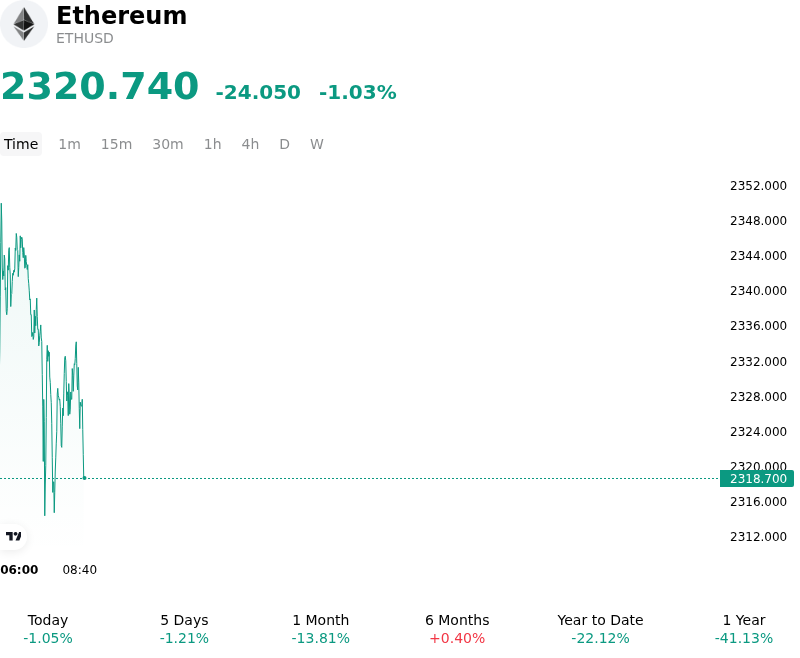
What is driving Ethereum (ETHUSD)’s stock price down today?
The recent downward price action in Ethereum reflects a broader repricing of liquidity across risk assets, driven by macroeconomic headwinds and elevated borrowing costs. A firmer U.S. dollar alongside sustained upward pressure on Treasury yields has incentivized institutional investors to trim exposure to higher-beta crypto assets in favor of capital preservation and cash-like instruments. With global funding conditions remaining tight and market participants calibrating interest rate expectations, risk sentiment across digital asset markets has deteriorated, triggering defensive positioning among institutional macro desks.
A primary catalyst behind the persistent selling pressure on Ethereum is the sustained outflow trend across spot Ethereum exchange-traded funds. Institutional products recorded substantial capital redemptions throughout the month, erasing prior cumulative gains and signaling a sharp decline in institutional demand. This persistent net flow drag has exacerbated spot market supply while highlighting Ethereum's underperformance relative to Bitcoin. Furthermore, with risk-free benchmark yields sitting near elevated levels, traditional fixed-income allocations continue to offer competitive yield alternatives without smart contract or market risk, blunting the relative appeal of on-chain staking returns.
On-chain and technical dynamics have further compounded intraday weakness, as spot prices failed to clear key resistance levels at short-term moving averages. The rejection at technical supply barriers triggered automated liquidations in derivatives markets, forcing long-position unwindings and driving speculative leverage out of the system. In addition, near-term uncertainty surrounding protocol upgrade timelines has temporarily removed potential narrative tailwinds, leaving the asset vulnerable to liquidity-driven sell-offs. Until spot ETF flows stabilize and broader macro liquidity conditions ease, Ethereum remains subject to heightened volatility and ongoing structural portfolio rebalancing.
Technical Analysis of Ethereum (ETHUSD)
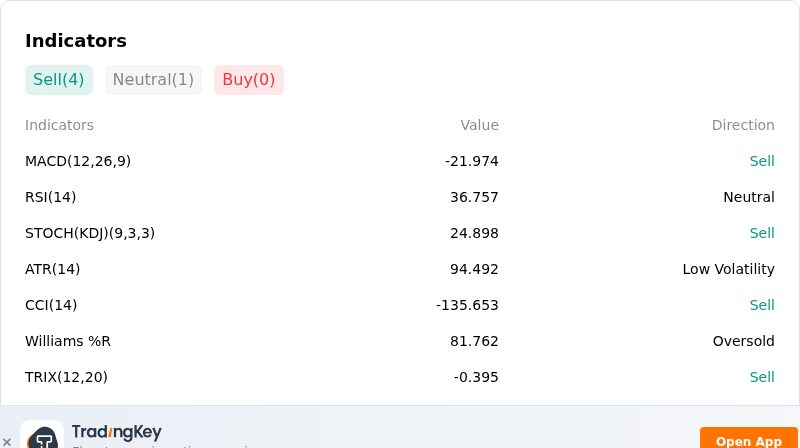
Technically, Ethereum (ETHUSD) shows a MACD (12,26,9) value of -21.974, indicating a sell signal. The RSI at 36.757 suggests neutral condition and the Williams %R at 81.762 suggests oversold condition. Please monitor closely.
More details about Ethereum (ETHUSD)
Recent Events and Risks:
- Institutional ETF Outflows: U.S. spot Ethereum ETFs recorded a fourth consecutive week of net redemptions totaling over $224 million, driven by substantial withdrawals from BlackRock's iShares Ethereum Trust (ETHA) and eroding institutional demand.
- Leveraged Long Liquidation Cascades: Derivatives positioning indicates up to $676 million in leveraged long perpetual contracts face forced liquidation on major centralized exchanges if spot ETH drops below the critical $2,286 support threshold.
- Deteriorating U.S. Spot Demand: On-chain metrics show the Coinbase Premium Index sliding to -0.137 alongside a rising trend in Ethereum exchange reserves, signaling active spot distribution and weak buying conviction from U.S.-based trading venues.
- Cross-Chain Security Incident Disruption: A security breach involving the Initia cross-chain bridge resulted in duplicate minted assets being swapped for real ETH on-chain, creating localized liquidity friction and unexpected spot reserve inflows.
This article may include AI-generated content that is human-reviewed, which is for reference and general information purposes only and does not constitute investment advice.
Recommended Articles









Comments (0)
Click the $ button, enter the symbol, and select to link a stock, ETF, or other ticker.