


Amazon.com Inc Stock (AMZN) Opened Down by 3.50% on Oct 22: Facts Behind the Movement



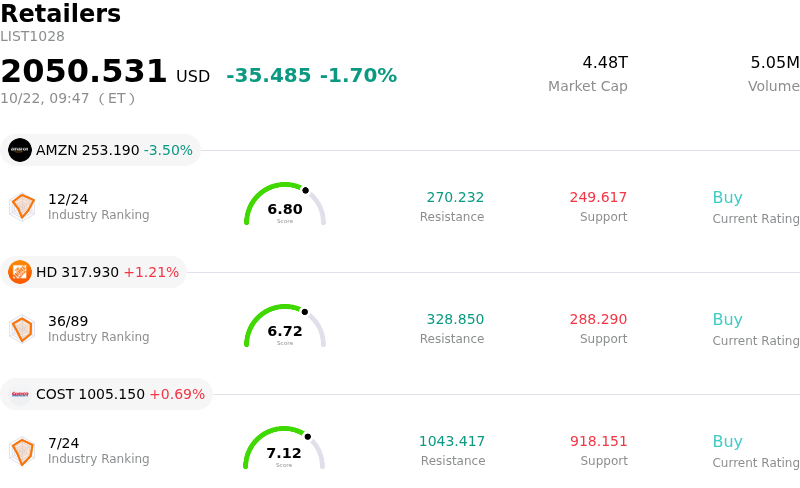
Amazon.com Inc (AMZN) opened down by 3.50%. The Retailers sector is down by 1.70%. The company underperformed the industry. Top 3 stocks by turnover in the sector: Amazon.com Inc (AMZN) down 3.50%; Home Depot Inc (HD) up 1.21%; Costco Wholesale Corp (COST) up 0.69%.
What is driving Amazon.com Inc (AMZN)’s stock price down today?
Amazon experienced a notable downward pull driven primarily by pre-earnings positioning, heightened scrutiny over capital expenditure, and profit-taking following recent gains. As the company approaches its third-quarter earnings release, market participants are exercising caution amidst ongoing debates over the profitability of heavy artificial intelligence infrastructure spending. Recent updates highlighting a massive annual capital expenditure projection have intensified worries regarding free cash flow compression, overshadowing optimistic long-term growth prospects for cloud computing.
Sector-wide volatility across mega-cap technology equities also exacerbated selling pressure. Investors remain sensitive to valuation metrics and the timing of returns on generative artificial intelligence investments. Although cloud revenue and backlog trends remain strong, market sentiment has been weighed down by guidance reflecting softer top-line momentum, partly due to calendar shifts in key promotional events earlier in the year.
Institutional portfolio adjustments ahead of earnings contributed to intraday volatility as fund managers rebalanced positions to manage risk. While analyst sentiment remains broadly positive regarding long-term core operations and advertising growth, short-term uncertainty surrounding margin dynamics and elevated data center buildout costs continues to anchor investor caution in the immediate term.
Technical Analysis of Amazon.com Inc (AMZN)
Technically, Amazon.com Inc (AMZN) shows a MACD (12,26,9) value of 1.014, indicating a buy signal. The RSI at 48.986 suggests neutral condition and the Williams %R at 62.366 suggests sell condition. Please monitor closely.
Media Coverage of Amazon.com Inc (AMZN)
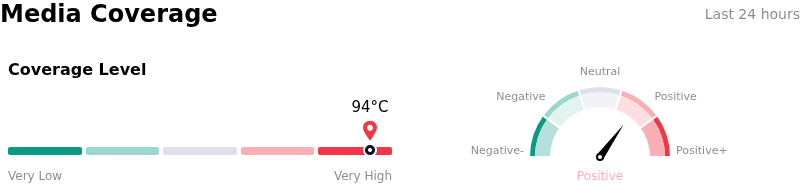
In terms of media coverage, Amazon.com Inc (AMZN) shows a coverage score of 94, indicating a very high level of media attention. The overall market sentiment index is currently in bullish zone.
Fundamental Analysis of Amazon.com Inc (AMZN)
Amazon.com Inc (AMZN) is in the Retailers industry. Its latest annual revenue is $716.92B, ranking 1 in the industry. The net profit is $77.67B, ranking 1 in the industry. Company Profile
Over the past month, multiple analysts have rated the company as Buy, with an average price target of $323.86, a high of $405.00, and a low of $207.00.
More details about Amazon.com Inc (AMZN)
Company Specific Risks:
- Escalating Capital Expenditure and Cash Flow Strains: Amazon's projected $220 billion capital expenditure budget for AI infrastructure has pushed trailing twelve-month free cash flow into negative territory at -$7.6 billion, raising institutional concern over cash burn and capital efficiency.
- FTC Antitrust Lawsuit Targeting Advertising Operations: A lawsuit filed by the FTC and 22 states alleges Amazon overcharged advertisers by more than $20 billion through hidden auction pricing, creating legal uncertainty and financial risk for its high-margin advertising segment.
- Impending Core Marketplace Trial and Regulatory Liability: Heightened federal scrutiny, including an FTC trial targeting marketplace pricing policies and growing regulatory liability regarding third-party products, threatens retail business margins.
- Sequential Retail Guidance Softness: Management's revenue guidance of $197 billion to $202 billion reflected underlying deceleration in e-commerce growth and foreign exchange headwinds, increasing stock volatility ahead of earnings.
This article may include AI-generated content that is human-reviewed, which is for reference and general information purposes only and does not constitute investment advice.
Recommended Articles









Comments (0)
Click the $ button, enter the symbol, and select to link a stock, ETF, or other ticker.