


Bitcoin (BTCUSD) Volatility Intensified on Oct 22: What You Should Know



Bitcoin (BTCUSD) is down 1.07% at Oct 22 21:45(ET), now at $83749.3, with a 7-day up of 2.03%.
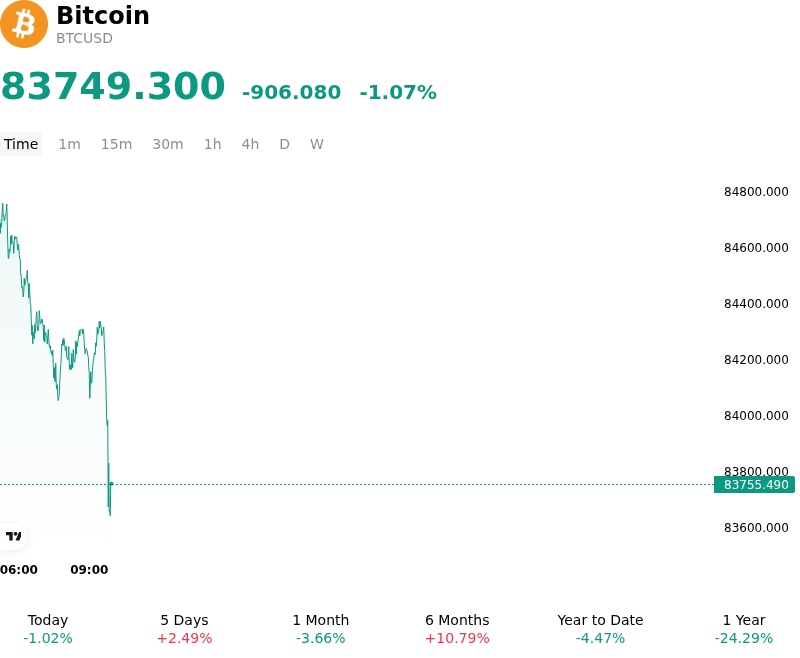
What is driving Bitcoin (BTCUSD)’s stock price down today?
Bitcoin experienced an intraday downside pullback as a short-term relief rally met persistent overhead resistance, triggering profit-taking and reduced risk exposure across digital asset markets. While recent brief rebounds in technology equities and spot ETF inflows offered temporary price support, upside momentum stalled near key overhead supply zones. Institutional investors opted to trim long exposure in response to lingering macroeconomic uncertainty, as markets continue to price in restrictive Federal Reserve monetary policy expectations and sticky bond yield dynamics.
Macroeconomic headwinds remain a central anchor on digital asset valuations. Sustained high US Treasury yields continue to raise the cost of capital, diminishing the relative attractiveness of non-yielding risk assets like Bitcoin. Concurrently, institutional demand through US spot Bitcoin ETFs has displayed mixed flow patterns rather than sustained structural accumulation. The lack of persistent multi-day net inflows suggests that institutional allocators are taking a tactical, defensive posture ahead of upcoming central bank rate decisions and macroeconomic data releases, limiting broad market liquidity expansion.
From a structural and technical perspective, Bitcoin continues to face significant overhead supply near key psychological and historic cost-basis levels. On-chain data indicates that investors who acquired positions near previous cycle highs are utilizing price rallies toward upper trading boundaries to achieve breakeven liquidity, capping momentum. In derivatives markets, modest long liquidations and a softening of perpetual futures funding rates point to leverage reduction among speculative traders. The combination of constrained spot buying, derivative long deleveraging, and stubborn macro yield pressures highlights an environment defined by range-bound consolidation rather than immediate trend continuation.
Technical Analysis of Bitcoin (BTCUSD)
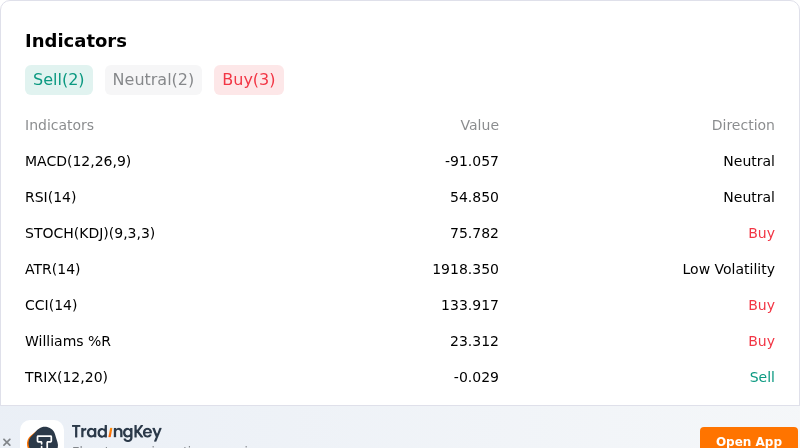
Technically, Bitcoin (BTCUSD) shows a MACD (12,26,9) value of -91.057, indicating a neutral signal. The RSI at 54.850 suggests neutral condition and the Williams %R at 23.312 suggests buy condition. Please monitor closely.
More details about Bitcoin (BTCUSD)
Recent Events and Risks:
- Derivatives Open Interest and Liquidation Risk: Futures market open interest remains heavily elevated alongside rising perpetual funding rates, leaving over-leveraged long positions exposed to sharp liquidation cascades if key support thresholds near $80,000 are breached.
- Rising Options Skew for Downside Protection: Institutional options data reveals that Bitcoin's 25-delta skew shifted higher as traders paid elevated premiums for downside put options relative to upside calls, signaling heightened defensive positioning and expectations of prospective spot price weakness.
- Concentrated Exchange Inflows and Potential Sell Pressure: Recent on-chain tracking highlighted large whale deposits totaling over $220 million in digital assets transferred to centralized exchange wallets within short windows, creating immediate risks of spot order book absorption issues and sudden downside volatility.
- Persistent Macro Rate Pressure and High Yields: Sticky U.S. inflation figures and elevated benchmark Treasury yields continue to bolster dollar strength, dampening overall risk-asset appetite and restricting institutional capital expansion into Bitcoin.
This article may include AI-generated content that is human-reviewed, which is for reference and general information purposes only and does not constitute investment advice.
Recommended Articles









Comments (0)
Click the $ button, enter the symbol, and select to link a stock, ETF, or other ticker.