


Solana (SOLUSD) Is down 1.07% on Oct 22: What Do On-Chain Data and Market Sentiment Show?



Solana (SOLUSD) is down 1.07% at Oct 22 21:35(ET), now at $105.91, with a 7-day up of 1.19%.
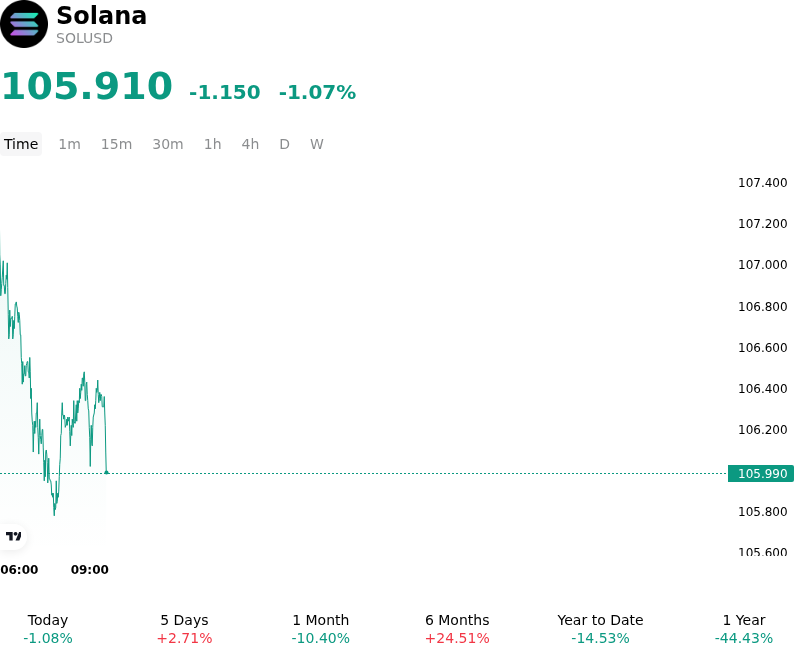
What is driving Solana (SOLUSD)’s stock price down today?
The downward pressure on Solana reflects a combination of persistent spot ETF outflows and broader institutional risk-aversion toward high-beta digital assets. Institutional investors have pared back exposure to alternative Layer-1 tokens amid sustained net withdrawals from spot Solana exchange-traded products, removing a primary source of structural buy-side support. This institutional capital exit coincides with a tighter macroeconomic environment, where hawkish Federal Reserve policy expectations and elevated U.S. Treasury yields continue to restrict speculative liquidity across high-duration risk assets and crypto markets.
From a market structure perspective, SOL encountered firm overhead resistance near its key short-term moving averages, triggering long liquidations and speculative profit-taking. The price action also illustrates a classic sell-the-news reaction following the activation of the major Alpenglow network upgrade. Although Alpenglow substantially improves network performance by drastically reducing transaction finality times, traders used the milestone event to reduce risk exposure. Concurrently, a decline in futures open interest points to systematic deleveraging in derivatives positioning rather than aggressive net-short accumulation, driving short-term price consolidation.
Despite the immediate softness in price and ETF capital flows, underlying network fundamentals continue to exhibit underlying strength. Solana maintains strong decentralized application revenue, steady stablecoin liquidity, and ongoing expansion in tokenized real-world assets and corporate integration. Consequently, the move reflects a tactical liquidity repricing and position reset rather than a structural breakdown in adoption. Institutional investors continue to watch for a stabilization in spot ETF flows and broader macroeconomic liquidity easing as catalysts for sustained capital re-entry.
Technical Analysis of Solana (SOLUSD)
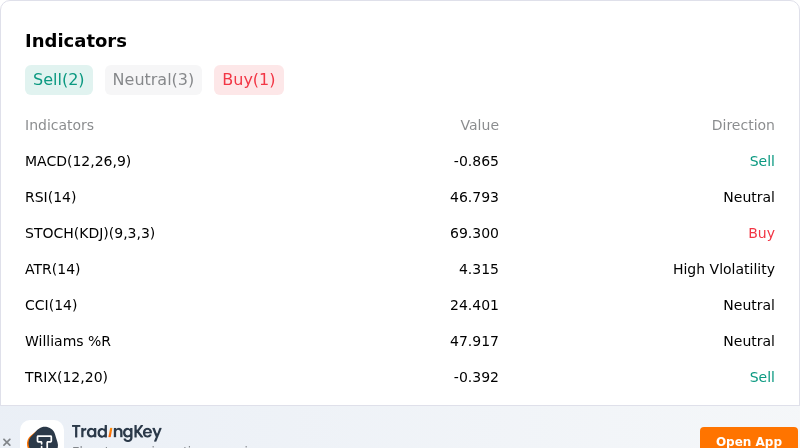
Technically, Solana (SOLUSD) shows a MACD (12,26,9) value of -0.865, indicating a sell signal. The RSI at 46.793 suggests neutral condition and the Williams %R at 47.917 suggests neutral condition. Please monitor closely.
More details about Solana (SOLUSD)
Recent Events and Risks:
- Persistent Institutional Spot ETF Outflows: Solana-focused exchange-traded products have recorded an extended streak of daily net outflows, with multi-million dollar institutional redemptions creating continuous overhead supply pressure and signaling reduced spot accumulation.
- Bearish Technical Pattern Threatening Key Support: Technical analysis highlights a daily head-and-shoulders formation, where a sustained daily breakdown below the key $100 psychological neckline threatens to trigger accelerated stop-loss liquidations toward lower support near $80.
- Whale Exchange Inflows and Distribution Overhang: On-chain monitoring reveals significant exchange-bound whale activity, including transfers exceeding 470,000 SOL worth over $51 million to Coinbase, increasing the immediate risk of large-scale spot market dumps.
- Derivatives Open Interest Contraction and Long Unwinding: Futures market data shows a sharp drop in Solana open interest alongside forced liquidations of leveraged long positions, amplifying intraday downside volatility during broader risk-off shifts.
This article may include AI-generated content that is human-reviewed, which is for reference and general information purposes only and does not constitute investment advice.
Recommended Articles








Comments (0)
Click the $ button, enter the symbol, and select to link a stock, ETF, or other ticker.