


XRP (XRPUSD) Is down 1.40% on Oct 22: What Are the Risk Factors?



XRP (XRPUSD) is down 1.40% at Oct 22 20:00(ET), now at $1.3652, with a 7-day up of 1.94%.
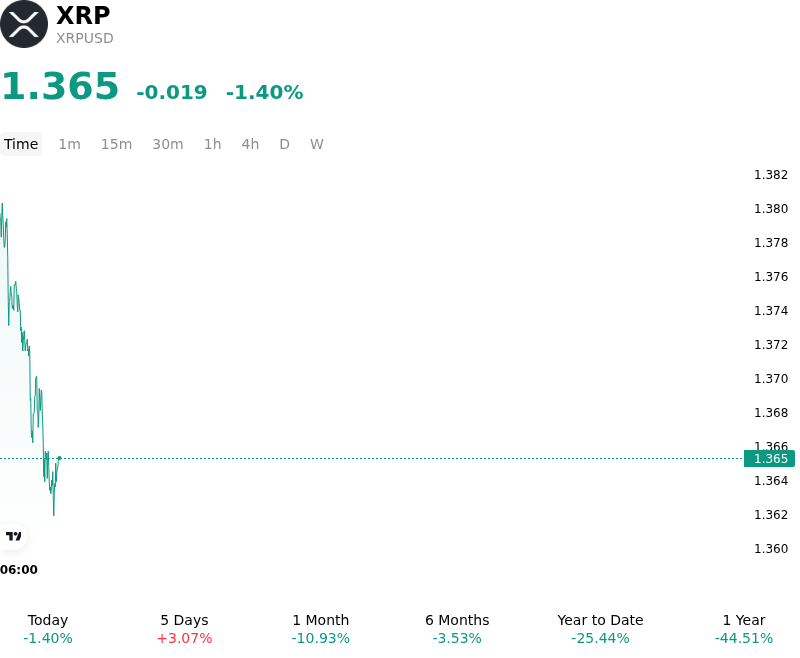
What is driving XRP (XRPUSD)’s stock price down today?
The pullback in XRP reflects broader macroeconomic caution and a temporary moderation in institutional spot exchange-traded fund demand. As crypto markets navigate sticky inflation concerns and shifting expectations surrounding Federal Reserve monetary policy, persistent yield volatility has restrained overall risk appetite across major altcoins. Concurrently, net capital inflows into spot XRP exchange-traded funds experienced a brief deceleration following weeks of sustained institutional accumulation, reducing the marginal buying volume required to absorb overhead supply. This reduction in spot demand left the asset susceptible to profit-taking after failing to clear major technical resistance boundaries.
Derivatives market mechanics and order book dynamics further amplified the downward pressure. A modest wave of long position liquidations occurred as short-term open interest adjusted, temporarily overpowering spot bids. While exchange balances have steadily trended downward due to ongoing institutional custody transfers and whale accumulation, spot market depth remained shallow during the trading session, making price action more sensitive to intraday liquidations. In addition, institutional investors remain attentive to long-term network fee mechanics and tokenized asset adoption, maintaining a disciplined valuation approach rather than chasing speculative price expansions.
Despite the temporary softness, XRP's broader structural framework continues to be supported by post-litigation regulatory clarity, expanding corporate treasury programs, and established spot ETF products. However, near-term price direction remains heavily dependent on macroeconomic liquidity conditions and a resurgence in ETF net creations. Investors continue to monitor Federal Reserve policy developments, institutional payment implementation, and derivatives positioning to evaluate whether the asset will re-establish upward momentum or remain confined to a broader consolidation range.
Technical Analysis of XRP (XRPUSD)
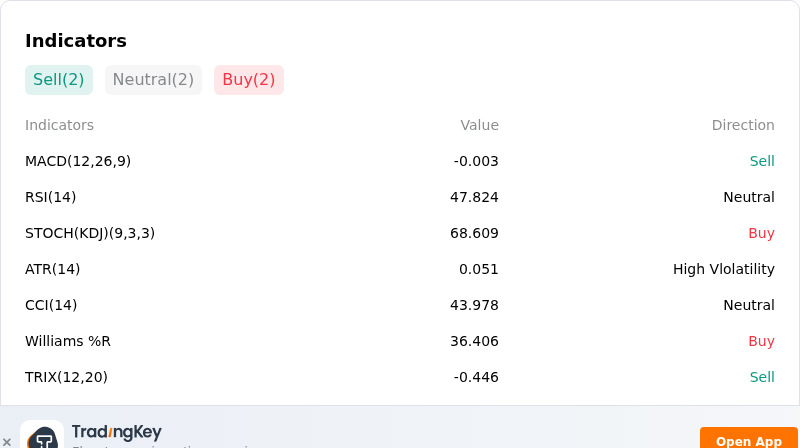
Technically, XRP (XRPUSD) shows a MACD (12,26,9) value of -0.003, indicating a sell signal. The RSI at 47.824 suggests neutral condition and the Williams %R at 36.406 suggests buy condition. Please monitor closely.
More details about XRP (XRPUSD)
Recent Events and Risks:
- Spot ETF Outflow Reversal: US-listed XRP spot ETFs recently ended a 13-week streak of continuous capital inflows by posting weekly net outflows, indicating a sudden freeze in institutional spot demand and removing a key driver of price support.
- Derivatives Open Interest and Leverage Unwind: Open interest in XRP perpetual futures has contracted significantly alongside a 26% decline in leverage ratios on major exchanges like Binance, signaling reduced trader conviction and lower market depth to absorb downside volatility.
- Elevated Exchange Supply Overhang: Exchange reserves have remained elevated near 11.8 billion XRP tokens, creating significant overhead sell pressure that risks triggering further liquidations if price breaches crucial technical support near $1.28 to $1.30.
- Drop in On-Chain Payment Volume: Daily transactional volume on the XRP Ledger dropped over 70% below its 30-day average during recent sessions, highlighting a sharp drop in network activity and utility demand during price consolidation.
This article may include AI-generated content that is human-reviewed, which is for reference and general information purposes only and does not constitute investment advice.
Recommended Articles









Comments (0)
Click the $ button, enter the symbol, and select to link a stock, ETF, or other ticker.