


International Business Machines Corp Stock (IBM) Closed Up by 3.94% on Oct 21: What Signal Does It Send?



International Business Machines Corp (IBM) closed up by 3.94%. The Software & IT Services sector is down by 0.41%. The company outperformed the industry. Top 3 stocks by turnover in the sector: Meta Platforms Inc (META) up 0.47%; Alphabet Inc Class A (GOOGL) down 1.64%; Alphabet Inc Class C (GOOG) down 1.63%.
What is driving International Business Machines Corp (IBM)’s stock price up today?
International Business Machines experienced strong upward momentum, driven by investor enthusiasm surrounding its third-quarter earnings results and raised full-year free cash flow guidance. The technology giant delivered top-line performance that surpassed market expectations, propelled by accelerated expansion in its core Software and Infrastructure divisions. Management’s decision to elevate its full-year cash flow outlook reinforced confidence in the firm's financial discipline and dividend sustainability. Crucially, market sentiment rebounded as evidence indicated that major enterprise software and mainframe deals delayed from the preceding quarter were successfully finalized, easing operational concerns that had previously weighed on performance.
Broad-based buying interest was further catalyzed by expanding commercial momentum across enterprise artificial intelligence and hybrid cloud initiatives. Recent strategic collaborations, including high-profile partnerships with OpenAI and Together AI alongside semiconductor research initiatives with Siemens Energy, underscored the company's ongoing technology modernization. As corporate clients increasingly deploy enterprise-grade AI architectures to transform business operations, the company's high-margin software offerings and enterprise consulting services remain well-positioned to capture IT spending.
Positive institutional positioning and favorable analyst commentary provided additional tailwinds. Wall Street research updates highlighted reasonable valuation metrics and an attractive dividend yield compared to the broader technology sector. The combination of accelerating fundamental growth, operational execution, and upgraded financial targets supported positive trading dynamics throughout the session.
Technical Analysis of International Business Machines Corp (IBM)
Technically, International Business Machines Corp (IBM) shows a MACD (12,26,9) value of 5.779, indicating a neutral signal. The RSI at 69.913 suggests neutral condition and the Williams %R at 0.620 suggests overbought condition. Please monitor closely.
Media Coverage of International Business Machines Corp (IBM)
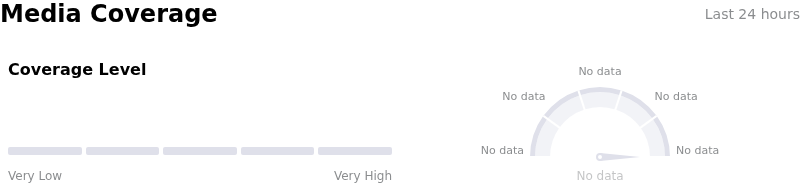
In terms of media coverage, International Business Machines Corp (IBM) shows a coverage score of 49, indicating a moderate level of media attention. The overall market sentiment index is currently in bullish zone.
Fundamental Analysis of International Business Machines Corp (IBM)
International Business Machines Corp (IBM) is in the Software & IT Services industry. Its latest annual revenue is $67.53B, ranking 7 in the industry. The net profit is $10.59B, ranking 11 in the industry. Company Profile
Over the past month, multiple analysts have rated the company as Buy, with an average price target of $245.12, a high of $350.00, and a low of $174.00.
More details about International Business Machines Corp (IBM)
Company Specific Risks:
- AI Infrastructure Spend Monetization Delay: Institutional analysts at Truist and Morgan Stanley expressed concern that enterprise client expenditure on AI infrastructure is taking longer than anticipated to translate into high-margin software and consulting revenue, creating execution risk.
- Software Growth Deceleration and Organic Flatness: Enterprise software performance faces underlying weakness, highlighted by recent quarterly slowdowns to 5% growth where organic revenue was flat without acquisitions and mainframe-linked transaction processing dropped 8%.
- Post-Earnings Volatility Exposure: Options traders priced in an implied price movement of 7.16% ($16.93 per share) ahead of Q3 earnings, leaving the stock vulnerable to sharp downside re-testing toward previous $197 lows if software deal recovery disappoints expectations.
- Insider Share Offloading and Margin Compression: SEC disclosures and recent market tracking show $5.75 million in insider selling over the trailing three months, alongside GAAP gross profit margin narrowing by 50 basis points year-over-year.
This article may include AI-generated content that is human-reviewed, which is for reference and general information purposes only and does not constitute investment advice.
Recommended Articles








Comments (0)
Click the $ button, enter the symbol, and select to link a stock, ETF, or other ticker.