


Bloom Energy Corp Stock (BE) Moved Up by 7.68% on Oct 21: Key Drivers Unveiled



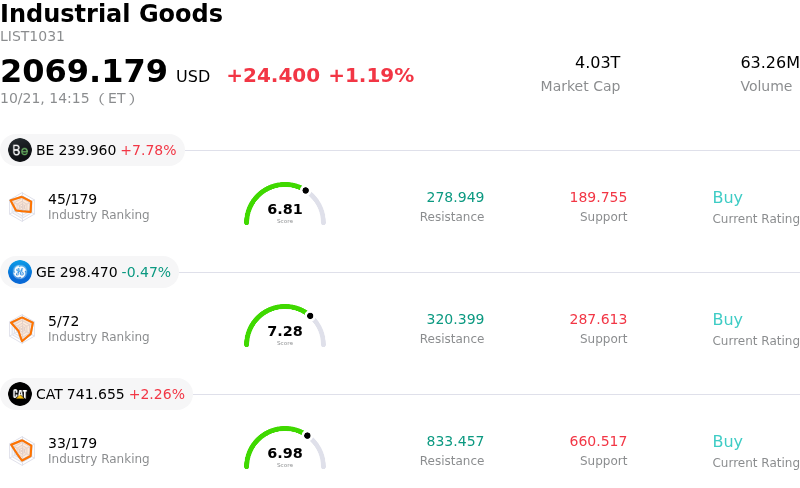
Bloom Energy Corp (BE) moved up by 7.68%. The Industrial Goods sector is up by 1.19%. The company outperformed the industry. Top 3 stocks by turnover in the sector: Bloom Energy Corp (BE) up 7.78%; General Electric Co (GE) down 0.47%; Caterpillar Inc (CAT) up 2.26%.
What is driving Bloom Energy Corp (BE)’s stock price up today?
Bloom Energy experienced notable upward momentum driven primarily by heightened investor positioning ahead of its third-quarter earnings announcement. Market sentiment surrounding the company has been increasingly constructive, supported by expectations of strong top- and bottom-line growth. Investors are actively evaluating the company’s ability to deliver on its raised full-year guidance and maintain strong momentum in converting its growing backlog.
A primary catalyst underpinning the move is the escalating demand for power solutions from artificial intelligence and cloud data center operators. As traditional electrical grid interconnection delays continue to bottleneck major digital infrastructure projects, hyperscalers and colocation facilities are increasingly turning to solid-oxide fuel cell systems for rapid, reliable, on-site power generation. Broad commercial adoption by major technology and cloud leaders has reinforced confidence in the company’s expansion trajectory, triggering recent price target increases and positive commentary from several major Wall Street brokerages.
The significant intraday volatility underscores a dynamic trading session of position adjustments ahead of the financial report. Following recent pullbacks from previous highs, buyers stepped in near key support levels to capitalize on the dip. While high valuation metrics and execution requirements regarding manufacturing scale-up remain focal points for cautious investors, the prevailing market momentum is driven by strong structural demand for decentralized energy across the expanding AI ecosystem.
Technical Analysis of Bloom Energy Corp (BE)
Technically, Bloom Energy Corp (BE) shows a MACD (12,26,9) value of -13.689, indicating a sell signal. The RSI at 44.718 suggests neutral condition and the Williams %R at 69.365 suggests sell condition. Please monitor closely.
Media Coverage of Bloom Energy Corp (BE)
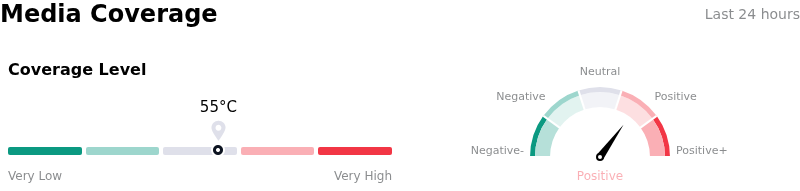
In terms of media coverage, Bloom Energy Corp (BE) shows a coverage score of 55, indicating a moderate level of media attention. The overall market sentiment index is currently in bullish zone.
Fundamental Analysis of Bloom Energy Corp (BE)
Bloom Energy Corp (BE) is in the Industrial Goods industry. Its latest annual revenue is $2.02B, ranking 78 in the industry. The net profit is $-88.43M, ranking 210 in the industry. Company Profile
Over the past month, multiple analysts have rated the company as Buy, with an average price target of $277.81, a high of $354.00, and a low of $98.94.
More details about Bloom Energy Corp (BE)
Company Specific Risks:
- Valuation Compression Ahead of Earnings: Trading at an extreme price-to-earnings multiple exceeding 300x, the stock faces heightened volatility and aggressive profit-taking if upcoming quarterly results fail to exceed elevated market expectations.
- Project Jupiter Contract and Execution Delays: Recent force majeure notices and proposed output caps regarding Oracle's New Mexico data center project threaten revenue timing and backlog conversion on one of the company's largest anchor contracts.
- Sequential Profitability and Sales Deceleration: Consensus analyst estimates model a sequential dip in third-quarter revenue and earnings relative to second-quarter figures, leaving the stock vulnerable to sharp downside if product delivery or gross margins miss targets.
- Heavy Insider Divestment and Debt Exposure: Substantial insider selling totaling over $165 million over the past year with zero insider buys, coupled with a persistent heavy debt load, underscores ongoing capital structure and balance sheet vulnerabilities.
This article may include AI-generated content that is human-reviewed, which is for reference and general information purposes only and does not constitute investment advice.
Recommended Articles








Comments (0)
Click the $ button, enter the symbol, and select to link a stock, ETF, or other ticker.