


KLA Corp Stock (KLAC) Moved Up by 3.15% on Oct 19: Facts Behind the Movement



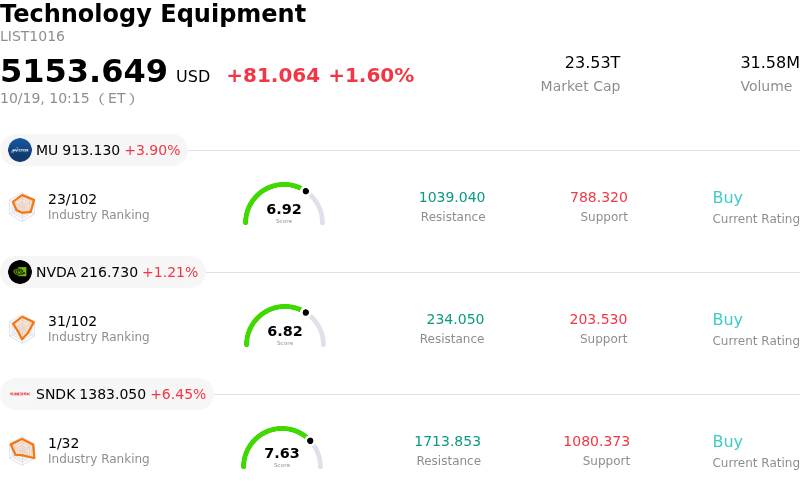
KLA Corp (KLAC) moved up by 3.15%. The Technology Equipment sector is up by 1.60%. The company outperformed the industry. Top 3 stocks by turnover in the sector: Micron Technology Inc (MU) up 3.97%; NVIDIA Corp (NVDA) up 1.24%; SanDisk Corporation (SNDK) up 6.43%.
What is driving KLA Corp (KLAC)’s stock price up today?
KLA Corporation experienced notable intraday volatility and closed higher as institutional investors stepped in to buy the dip following a recent multi-day consolidation across the semiconductor capital equipment sector. The upward movement reflects renewed confidence in the company's core process-control and yield-management fundamentals after a period of profit-taking hit high-multiple technology names.
A key factor supporting the positive momentum is the underlying strength of the semiconductor equipment sector, driven by aggressive capital expenditure in artificial intelligence hardware. Robust demand for advanced logic nodes, high-bandwidth memory, and complex 3D chip packaging has elevated the necessity of process-control intensity. With KLA holding a leading market position in metrology and wafer inspection tools, investors view the company as a critical bottleneck beneficiary in the AI supply chain. Positive long-term demand signals from industry peers and updated equipment spending forecasts have reinforced visibility into customer orders extending through multi-year horizons.
Market sentiment also benefited from positioning ahead of KLA's upcoming first-quarter fiscal 2027 earnings announcement scheduled for late October. Sector participants are anticipating strong operational performance in the second half of the calendar year, supported by expanding backlogs and high-margin service revenues. Although macroeconomic concerns and high valuation multiples have contributed to short-term trading fluctuations, strong institutional interest in premier equipment suppliers helped drive the stock's recovery.
Looking forward, KLA's near-term share price action will likely remain sensitive to broader technology sector sentiment, changes in global trade policies, and upcoming quarterly reports from key semiconductor manufacturing customers. However, the company's high gross margins, market dominance in process control, and exposure to long-term AI infrastructure buildouts continue to provide solid support during periods of market volatility.
Technical Analysis of KLA Corp (KLAC)
Technically, KLA Corp (KLAC) shows a MACD (12,26,9) value of -6.639, indicating a neutral signal. The RSI at 37.077 suggests neutral condition and the Williams %R at 86.362 suggests oversold condition. Please monitor closely.
Media Coverage of KLA Corp (KLAC)
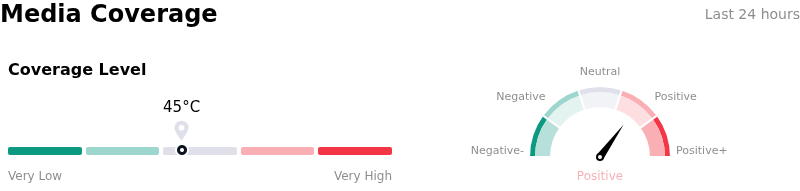
In terms of media coverage, KLA Corp (KLAC) shows a coverage score of 45, indicating a moderate level of media attention. The overall market sentiment index is currently in bullish zone.
Fundamental Analysis of KLA Corp (KLAC)
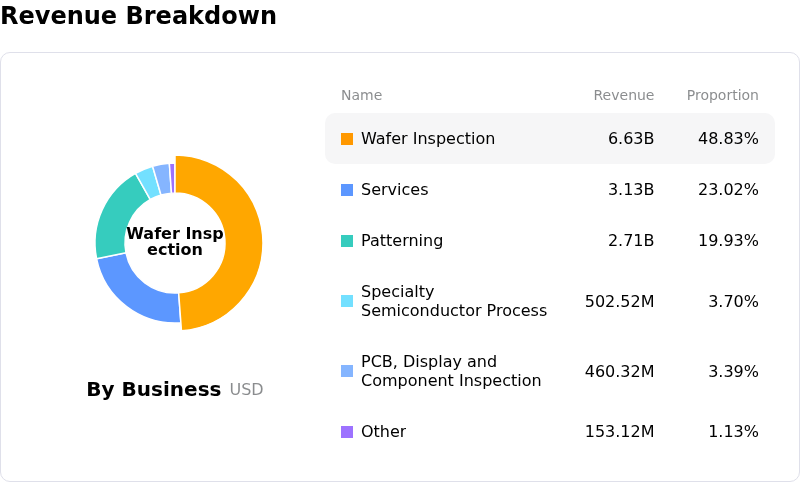
KLA Corp (KLAC) is in the Technology Equipment industry. Its latest annual revenue is $13.58B, ranking 15 in the industry. The net profit is $4.83B, ranking 11 in the industry. Company Profile
Over the past month, multiple analysts have rated the company as Buy, with an average price target of $229.23, a high of $325.00, and a low of $138.80.
More details about KLA Corp (KLAC)
Company Specific Risks:
- Prolonged Technical Breakdown and Institutional Liquidation: KLA experienced a record 10-session losing streak resulting in a 17% decline, driven by persistent ETF capital outflows, breakdown beneath its 50-day and 200-day moving averages, and systematic algorithmic sell pressure following a negative MACD crossover.
- Heightened Geopolitical and China Export Restriction Vulnerability: Tightening U.S. export controls and trade tariffs targeting Chinese semiconductor fabricators create direct operational headwinds, placing nearly 30% ($4.05 billion) of annual sales at risk and driving an estimated $300 million to $350 million top-line headwind.
- Valuation Compression and Wall Street Target Downgrades: Trading at an elevated forward earnings multiple of over 45x, institutional analysts including Morgan Stanley have reduced price targets, warning that premium valuation leaves the stock susceptible to aggressive profit-taking if AI infrastructure capital expenditure growth cools.
- Substantial Executive Insider Liquidations: Regulatory SEC filings highlight persistent insider disinvestments totaling over $46.9 million over recent months with zero purchases, led by Chief Executive Officer Richard Wallace liquidating over $12.38 million in shares, generating negative market sentiment around executive positioning.
This article may include AI-generated content that is human-reviewed, which is for reference and general information purposes only and does not constitute investment advice.
Recommended Articles








Comments (0)
Click the $ button, enter the symbol, and select to link a stock, ETF, or other ticker.