


WTI (USOIL) Drops on Oct 19: What Lie behind the Move?



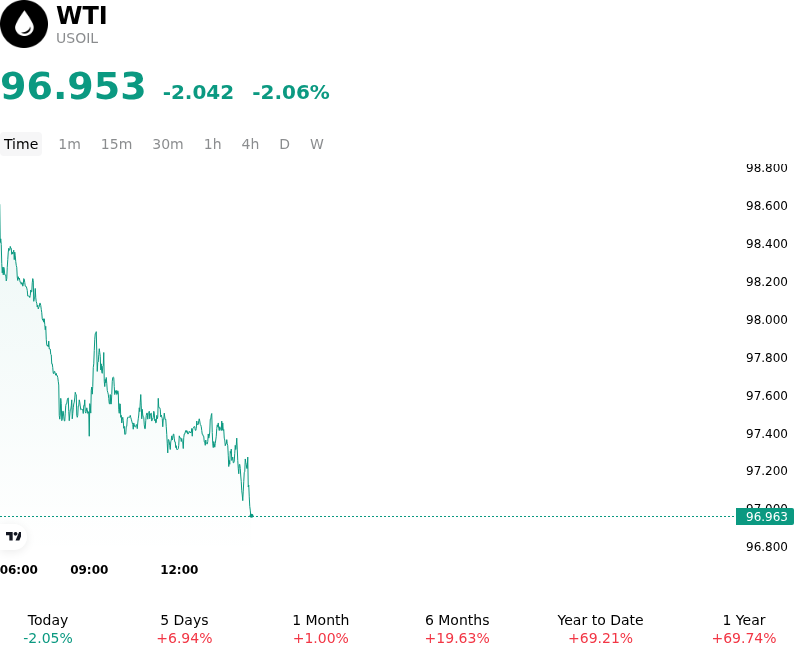
WTI (USOIL) is down 2.06% at Oct 19 02:25(ET), now at $96.953, with a 7-day up of 5.11%.
What is driving WTI (USOIL)’s stock price down today?
The pullback in US West Texas Intermediate crude futures was primarily driven by a shift in global supply expectations following U.S. policy actions to grant sanctions waivers on Russian fuel exports. The executive relief suspending key tariffs and sanctions raised the prospect of increased Russian refined product flows reaching international markets. This development provided immediate relief to tight distillate market expectations, prompting energy traders to unwind a portion of the supply-scarcity risk premium that had accumulated over previous sessions.
The downward pressure was further amplified by technical profit-taking after futures encountered significant overhead resistance near key psychological price levels. Crude markets had recently posted substantial gains driven by heightened geopolitical risk premiums stemming from Middle East maritime security concerns and regional shipping disruptions. Once the potential for expanded Russian export volumes emerged, institutional market participants moved to lock in profits, triggering technical selling and position unwinding.
Underlying demand fundamentals also contributed to the softer market tone. Successive demand growth downgrades from major international energy agencies, alongside persistent macroeconomic headwinds in core industrial economies, have reinforced expectations of a more balanced global supply-demand outlook heading into the end of the year. Although structural supply risks in the Persian Gulf remain an active tail risk, the market move predominantly reflected a recalibration of short-term supply availability against a backdrop of slowing global demand expansion.
Technical Analysis of WTI (USOIL)
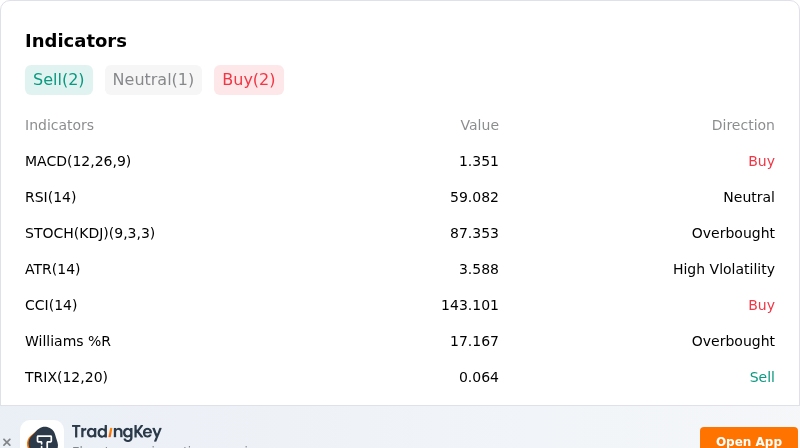
Technically, WTI (USOIL) shows a MACD (12,26,9) value of 1.375, indicating a buy signal. The RSI at 59.507 suggests neutral condition and the Williams %R at 15.755 suggests overbought condition. Please monitor closely.
More details about WTI (USOIL)
Recent Events and Risks:
- US Sanctions Waivers and Shipping Relief: Recent policy shifts, including executive orders waiving sanctions on Russian energy exports alongside potential regulatory relief for shadow fleet oil tankers, threaten to increase effective crude transport capacity and lower freight risk premiums, placing immediate downward pressure on futures prices.
- IEA Global Demand Forecast Downgrades: International energy bodies have trimmed global oil demand growth forecasts, citing prolonged macroeconomic headwinds, elevated energy costs, and slowing industrial consumption, which heightens downside risks of structural oversupply.
- Cushing Stock Builds and Refined Product Accumulation: Weekly inventory metrics showed localized crude inventory builds at the Cushing delivery hub and unexpected builds in domestic gasoline stocks, signaling underlying demand softness for refined fuels.
- Overbought Positioning and Technical Profit-Taking: Daily technical momentum indicators for USOIL are approaching overbought levels after testing recent highs, leaving the commodity vulnerable to sharp intraday profit-taking unwinds if geopolitical risk premiums temporarily recede.
This article may include AI-generated content that is human-reviewed, which is for reference and general information purposes only and does not constitute investment advice.
Recommended Articles








Comments (0)
Click the $ button, enter the symbol, and select to link a stock, ETF, or other ticker.