


Lam Research Corp Stock (LRCX) Moved Down by 3.63% on Oct 16: Facts Behind the Movement



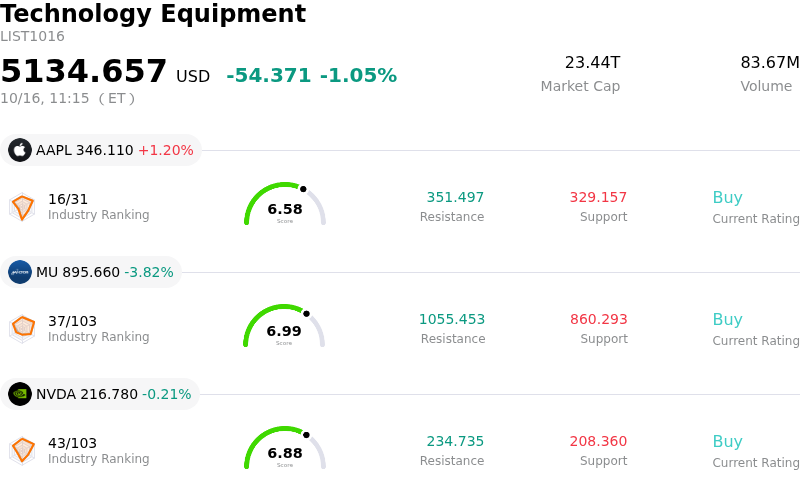
Lam Research Corp (LRCX) moved down by 3.63%. The Technology Equipment sector is down by 1.05%. The company underperformed the industry. Top 3 stocks by turnover in the sector: Apple Inc (AAPL) up 1.28%; Micron Technology Inc (MU) down 3.85%; NVIDIA Corp (NVDA) down 0.23%.
What is driving Lam Research Corp (LRCX)’s stock price down today?
Primary drivers behind the weakness in Lam Research center on pre-earnings position trimming and broader sector-wide volatility across the semiconductor equipment landscape. With the company scheduled to report its quarterly financial results on October 21, institutional investors have shown a tendency to de-risk high-beta technology holdings. Following a substantial rally earlier in the year driven by surging demand for artificial intelligence infrastructure and advanced wafer fabrication tools, the market is undergoing a period of profit-taking to consolidate prior gains.
Microeconomic factors and industry dynamics also play a key role in the intraday movement. Although major peers in the chip equipment sector have reported robust demand for advanced manufacturing tools, investor scrutiny regarding customer capital expenditure sustainability and memory chip investments remains elevated. Given the company's significant exposure to memory wafer fabrication processes, including deposition and etch systems for NAND and DRAM manufacturing, ongoing debates regarding major chipmakers' near-term capital deployment plans can prompt defensive trading across the stock.
Institutional rebalancing and valuation metrics further reinforce the current market sentiment. Disclosures highlighting recent institutional portfolio reductions alongside insider selling over recent quarters have weighed on short-term momentum. Furthermore, with valuation multiples elevated relative to historical averages, market participants are exercising caution, awaiting management's updated quarterly performance metrics and forward guidance on AI-driven equipment demand before reassessing positions.
Looking ahead, the long-term structural outlook for Lam Research remains closely anchored to global semiconductor capital expenditure cycles and technology transitions in advanced node manufacturing. However, until the upcoming earnings report provides greater clarity on order visibility and forward operational guidance, near-term price behavior is expected to remain sensitive to macroeconomic sentiment and tech-sector portfolio adjustments.
Technical Analysis of Lam Research Corp (LRCX)
Technically, Lam Research Corp (LRCX) shows a MACD (12,26,9) value of -13.612, indicating a neutral signal. The RSI at 31.230 suggests neutral condition and the Williams %R at 98.369 suggests oversold condition. Please monitor closely.
Media Coverage of Lam Research Corp (LRCX)
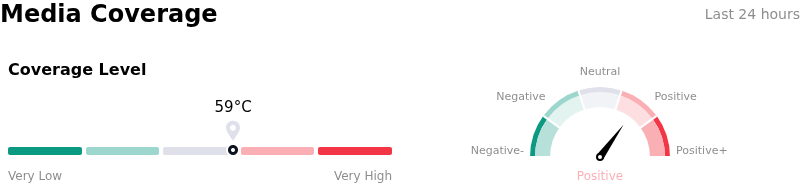
In terms of media coverage, Lam Research Corp (LRCX) shows a coverage score of 59, indicating a moderate level of media attention. The overall market sentiment index is currently in bullish zone.
Fundamental Analysis of Lam Research Corp (LRCX)
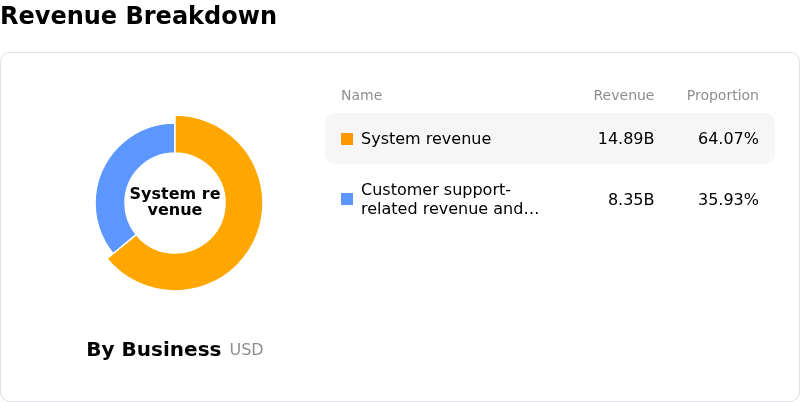
Lam Research Corp (LRCX) is in the Technology Equipment industry. Its latest annual revenue is $23.23B, ranking 12 in the industry. The net profit is $7.27B, ranking 7 in the industry. Company Profile
Over the past month, multiple analysts have rated the company as Buy, with an average price target of $371.82, a high of $500.00, and a low of $213.00.
More details about Lam Research Corp (LRCX)
Company Specific Risks:
- Multi-Day Pre-Earnings Selling Pressure: Lam Research has experienced a seven-consecutive-session decline, dropping over 10% as institutional investors actively lock in gains and trim tech exposure ahead of the upcoming October 21 earnings announcement.
- Severe Valuation Premium and Downside Vulnerability: Key valuation metrics indicate significant overvaluation, with quantitative models rating the stock's valuation at an 'F' grade and trading roughly 85% to 96% above intrinsic value estimates, exposing shares to sharp multiple compression upon any financial misstep.
- Heightened Consensus Expectations and Guidance Risks: Consensus targets require year-over-year quarterly EPS growth of over 72% alongside $8.12 billion in revenue, leaving zero margin for error regarding future wafer fab equipment spending guidance and memory customer capital expenditure forecasts.
- High-Beta Semiconductor Sector Sensitivity: Carrying a elevated beta of 1.85, the stock suffers from amplified intraday volatility and downside exposure during broad-based semiconductor hardware sell-offs and institutional position rebalancing.
This article may include AI-generated content that is human-reviewed, which is for reference and general information purposes only and does not constitute investment advice.
Recommended Articles









Comments (0)
Click the $ button, enter the symbol, and select to link a stock, ETF, or other ticker.