


Micron Technology Inc Stock (MU) Moved Down by 3.64% on Oct 16: A Full Analysis



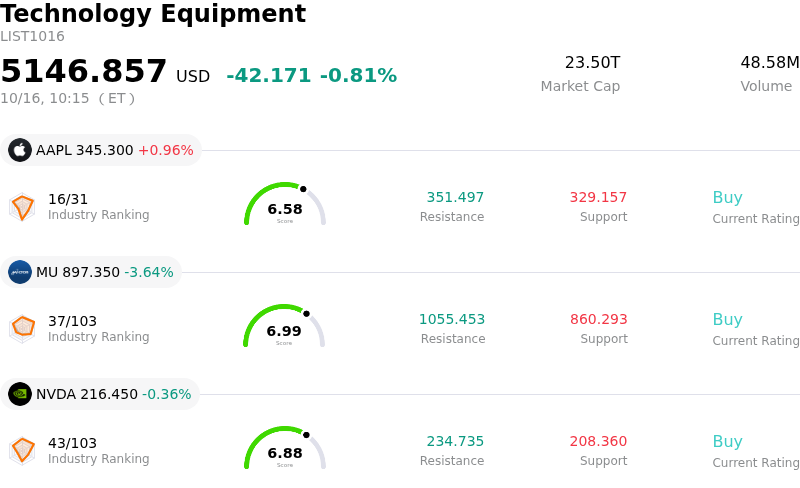
Micron Technology Inc (MU) moved down by 3.64%. The Technology Equipment sector is down by 0.81%. The company underperformed the industry. Top 3 stocks by turnover in the sector: Apple Inc (AAPL) up 0.93%; Micron Technology Inc (MU) down 3.64%; NVIDIA Corp (NVDA) down 0.34%.
What is driving Micron Technology Inc (MU)’s stock price down today?
The drop in Micron Technology’s share price alongside significant intraday volatility was primarily driven by competitive headlines and broader profit-taking within the semiconductor space. Market sentiment took a hit following reports of technical advancements and capacity expansion by Chinese DRAM manufacturer ChangXin Memory Technologies. The prospect of increased global DRAM supply stoked investor fears regarding potential pricing pressure and market share competition in standard memory modules, prompting a sector-wide pullback that affected major memory producers.
Beyond specific competitive developments, macro-level trading dynamics and sector rotation contributed to the heightened selling pressure. Semiconductor equities have experienced substantial gains on the back of artificial intelligence infrastructure spending, leading institutional and retail market participants to take profits following recent multi-month rallies. This sector-wide de-risking, combined with elevated options volume and recent insider transaction filings, created additional technical friction and amplified short-term downward momentum.
Despite the immediate market reaction, institutional research suggests the pullback reflects short-term sentiment recalibration rather than a structural decline in business fundamentals. Micron’s strategic pivot toward high-bandwidth memory (HBM) for artificial intelligence applications insulates a significant portion of its revenue from commoditized DRAM pricing fluctuations. Furthermore, multi-year customer supply agreements and tight capacity constraints in high-end data center memory continue to support favorable medium-term margins, providing a solid operational floor despite near-term technical volatility.
Technical Analysis of Micron Technology Inc (MU)
Technically, Micron Technology Inc (MU) shows a MACD (12,26,9) value of -45.380, indicating a neutral signal. The RSI at 35.404 suggests neutral condition and the Williams %R at 85.456 suggests oversold condition. Please monitor closely.
Media Coverage of Micron Technology Inc (MU)
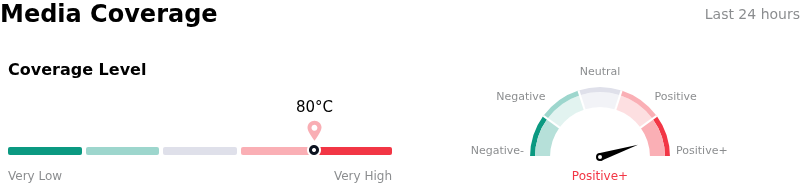
In terms of media coverage, Micron Technology Inc (MU) shows a coverage score of 80, indicating a high level of media attention. The overall market sentiment index is currently in extremely bullish zone.
Fundamental Analysis of Micron Technology Inc (MU)
Micron Technology Inc (MU) is in the Technology Equipment industry. Its latest annual revenue is $133.19B, ranking 2 in the industry. The net profit is $84.97B, ranking 2 in the industry. Company Profile
Over the past month, multiple analysts have rated the company as Buy, with an average price target of $1538.93, a high of $3000.00, and a low of $361.00.
More details about Micron Technology Inc (MU)
Company Specific Risks:
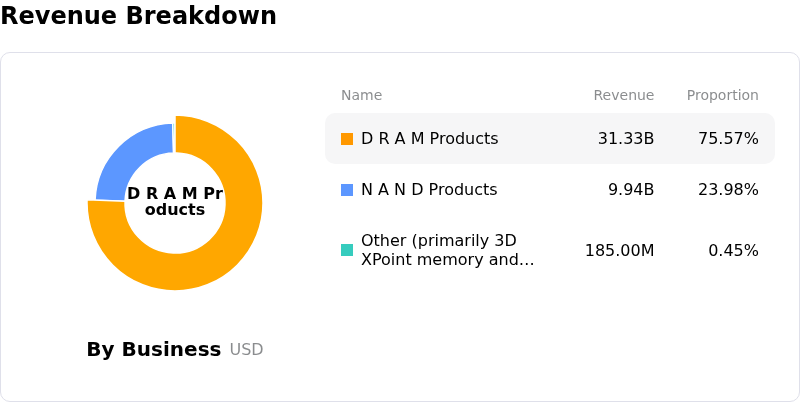
- Competitive Technological Disruptions in DRAM: Recent disclosures surrounding Chinese competitor ChangXin Memory Technologies' (CXMT) high-density "4F square" DRAM breakthrough have ignited investor fears of pricing pressure and market share loss in Micron's core DRAM segment, which drives roughly 73% of total revenue.
- Memory Pricing Cycle Peak Concerns: Institutional analysts and market participants highlight potential downside risks as the broader memory sector shows signs of cyclical peaking, where any easing in DRAM and NAND supply shortages could quickly compress gross margins and derail earnings growth.
- Executive Insider Dispositions: Form 4 regulatory filings revealing multi-million dollar stock sales by key management, including Senior Vice President Michael Ray, have contributed to intraday volatility and amplified negative momentum during an ongoing stock pullback.
- Capital Spending and Capacity Expansion Exposure: Massive increases in capital expenditures to fund multibillion-dollar megafab projects in New York and Singapore create cash flow vulnerability if chip demand decelerates before new capacity generates expected returns.
This article may include AI-generated content that is human-reviewed, which is for reference and general information purposes only and does not constitute investment advice.
Recommended Articles









Comments (0)
Click the $ button, enter the symbol, and select to link a stock, ETF, or other ticker.