


Solana (SOLUSD) Volatility Intensified on Oct 12: What You Should Know



Solana (SOLUSD) is up 1.11% at Oct 12 00:40(ET), now at $111.57, with a 7-day down of 6.75%.
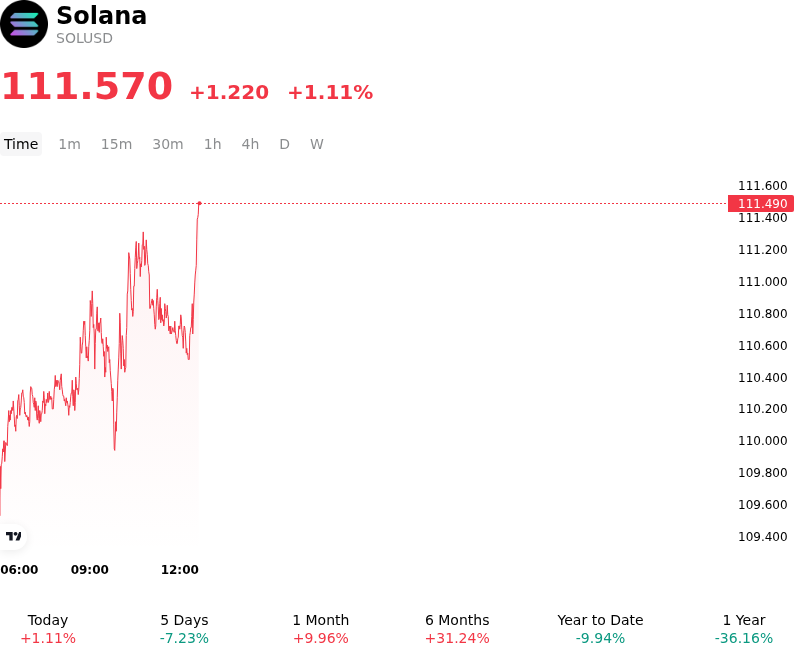
What is driving Solana (SOLUSD)’s stock price up today?
Solana advanced as capital flows into major Layer-1 smart contract platforms stabilized following high-profile institutional adoption announcements and an improving liquidity backdrop. Sentiment around the ecosystem received a structural boost from major enterprise integrations, notably the launch of the Solana Delivery-versus-Payment program designed with input from J.P. Morgan for atomic financial clearing, alongside Samsung integrating Solana-based stablecoin rails across millions of mobile devices. These enterprise-grade milestones reinforced Solana's position as a primary public blockchain venue for real-world asset settlement and global payment infrastructure, prompting macro and crypto-native funds to re-engage with the token.
On-chain metrics further supported the upward trajectory, characterized by record growth in stablecoin wallet adoption and steady total value locked across decentralized finance protocols. Although spot investment products experienced brief flow consolidation in prior sessions, spot market buyers absorbed supply near critical technical support levels. In the derivatives market, open interest expanded alongside a moderate uptick in funding rates, reflecting a healthy replenishment of leverage without signaling overextended speculative positioning. Short covering by derivatives traders following recent market-wide liquidations also accelerated positive intraday price momentum.
From a global macro perspective, stabilizing treasury yields and broader risk-on sentiment across digital asset markets enabled high-beta Layer-1 assets like Solana to outperform broader market benchmarks. While investors remain attentive to macro monetary policy trajectories, potential regulatory shifts, and token unlock schedules, the combination of expanding real-world utility, robust network throughput, and deepening institutional settlement integrations continues to support a constructive medium-term structural thesis for the asset.
Technical Analysis of Solana (SOLUSD)
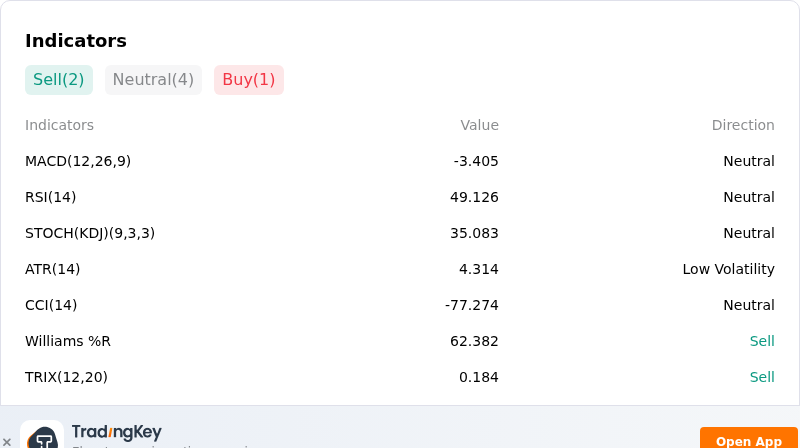
Technically, Solana (SOLUSD) shows a MACD (12,26,9) value of -3.405, indicating a neutral signal. The RSI at 49.126 suggests neutral condition and the Williams %R at 62.382 suggests sell condition. Please monitor closely.
More details about Solana (SOLUSD)
Recent Events and Risks:
- Spot ETF Outflows & Cooling Institutional Demand: Spot Solana ETFs recorded over $24 million in net outflows across consecutive trading sessions, snapping a 14-week streak of net inflows and removing key institutional buy-side support during market pullbacks.
- On-Chain Liquidity & Stablecoin Capital Contraction: On-chain metrics reveal a $1.12 billion decline in Solana's stablecoin reserves (a 6.4% contraction) alongside a fall in overall DeFi Total Value Locked (TVL), pointing to shrinking network cash reserves and reduced active trading liquidity.
- Derivatives Deleveraging & Liquidation Risk: A price breakdown beneath key support around $116–$117 sparked millions of dollars in forced long liquidations across perpetual futures venues, reducing futures open interest and leaving SOL vulnerable to further forced selling toward lower support levels near $106–$110.
- Whale Unstaking & Centralized Exchange Inflows: On-chain tracking highlights substantial whale unstaking activity alongside multi-million-dollar SOL transfers into centralized exchange wallets, increasing immediate liquid supply and generating overhead spot selling pressure.
This article may include AI-generated content that is human-reviewed, which is for reference and general information purposes only and does not constitute investment advice.
Recommended Articles









Comments (0)
Click the $ button, enter the symbol, and select to link a stock, ETF, or other ticker.