


Coherent Corp Stock (COHR) Moved Down by 5.64% on Oct 8: Drivers Behind the Movement



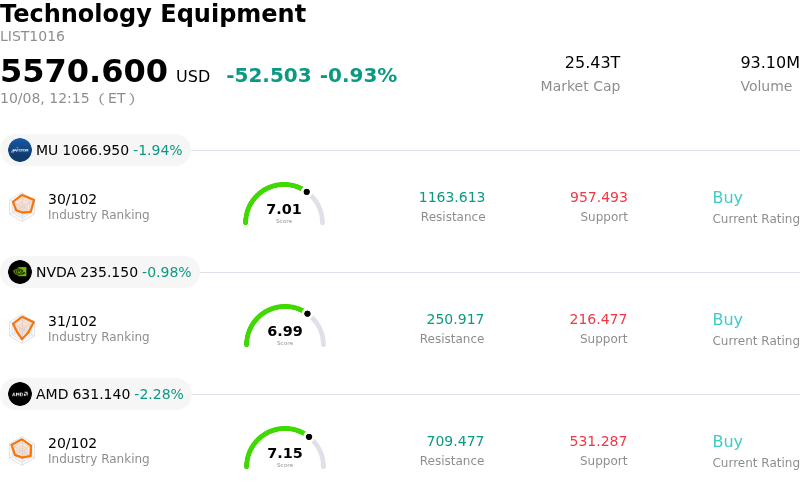
Coherent Corp (COHR) moved down by 5.64%. The Technology Equipment sector is down by 0.93%. The company underperformed the industry. Top 3 stocks by turnover in the sector: Micron Technology Inc (MU) down 1.92%; NVIDIA Corp (NVDA) down 0.97%; Advanced Micro Devices Inc (AMD) down 2.28%.
What is driving Coherent Corp (COHR)’s stock price down today?
Coherent Corp. experienced downward stock price movement driven primarily by a sector-wide profit-taking surge across optical component manufacturers and AI hardware suppliers. Following an extended multi-week rally fueled by enthusiasm over next-generation transceivers and the recent launch of its integrated optics platform, investors chose to lock in gains. The pullback was reflective of a broader unwind across the optical networking group, where several high-flying peers faced similar downside pressure as market participants rebalanced positions following strong year-to-date performances.
Broader market softness across major benchmark indices added pressure, as macro risk-off sentiment typically exerts a magnified impact on high-beta technology equities. Trading at a premium valuation relative to historical averages and industry peers, Coherent remains particularly sensitive to broader market pullbacks. Added pressure stemmed from options market activity showing elevated put volume, signaling institutional hedging, alongside recent corporate insider disclosures detailing share disposals. These indicators combined to temper near-term momentum and trigger short-term risk reduction among tactical traders.
Despite the temporary decline, the structural demand outlook for Coherent remains solidly supported by strong underlying fundamentals. Accelerating capital expenditure from hyperscalers into artificial intelligence infrastructure, coupled with multi-year purchase commitments extending into future calendar years, underpins long-term demand for high-speed optical transceivers, silicon photonics, and laser components. Nevertheless, with quarterly earnings approaching in early November, investors appear to be engaging in pre-earnings de-risking and tactical repositioning to navigate potential volatility.
Technical Analysis of Coherent Corp (COHR)
Technically, Coherent Corp (COHR) shows a MACD (12,26,9) value of 7.227, indicating a buy signal. The RSI at 52.864 suggests neutral condition and the Williams %R at 38.154 suggests buy condition. Please monitor closely.
Media Coverage of Coherent Corp (COHR)
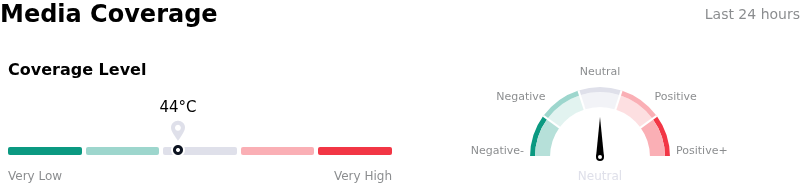
In terms of media coverage, Coherent Corp (COHR) shows a coverage score of 44, indicating a moderate level of media attention. The overall market sentiment index is currently in neutral zone.
Fundamental Analysis of Coherent Corp (COHR)
Coherent Corp (COHR) is in the Technology Equipment industry. Its latest annual revenue is $7.12B, ranking 10 in the industry. The net profit is $769.90M, ranking 9 in the industry. Company Profile
Over the past month, multiple analysts have rated the company as Buy, with an average price target of $410.10, a high of $500.00, and a low of $280.00.
More details about Coherent Corp (COHR)
Company Specific Risks:
- Heavy Bearish Options Flow and Pre-Earnings De-risking: A sudden surge in bearish options positioning, marked by put option volume running at roughly 1.6 times its average pace, combined with institutional position trimming ahead of upcoming quarterly earnings, has accelerated intraday downside momentum.
- Executive Insider Share Liquidations: Recent Form 4 filings with the SEC revealing stock sales by key corporate leadership, including the Chief Technology Officer and members of the Board of Directors, have triggered investor caution and diminished confidence following the equity's recent price rally.
- Aggressive CapEx Ramps and Cash Flow Compression: Rapidly expanding capital expenditures to scale 6-inch indium phosphide manufacturing and next-generation transceiver production have created severe cash flow strain, leaving profit margins vulnerable to potential capacity bottlenecks or demand digestion cycles.
- Elevated Valuation Sensitivity and High Beta Exposure: Carrying a trailing price-to-earnings multiple above 70x and a high beta coefficient near 2.3, the stock offers negligible valuation protection, amplifying price drawdowns whenever broader market risk-off sentiment or surging Treasury yields press tech valuations.
This article may include AI-generated content that is human-reviewed, which is for reference and general information purposes only and does not constitute investment advice.
Recommended Articles









Comments (0)
Click the $ button, enter the symbol, and select to link a stock, ETF, or other ticker.