


STMicroelectronics NV Stock (STM) Moved Down by 5.04% on Oct 7: A Full Analysis



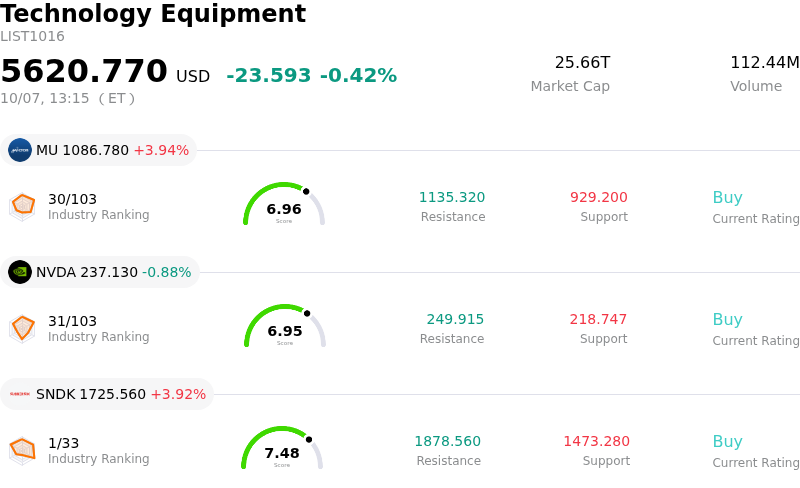
STMicroelectronics NV (STM) moved down by 5.04%. The Technology Equipment sector is down by 0.42%. The company underperformed the industry. Top 3 stocks by turnover in the sector: Micron Technology Inc (MU) up 3.94%; NVIDIA Corp (NVDA) down 0.88%; SanDisk Corporation (SNDK) up 3.92%.
What is driving STMicroelectronics NV (STM)’s stock price down today?
STMicroelectronics experienced a sharp pullback as profit-taking swept through high-beta semiconductor equities following an extended multi-week rally. Investors chose to lock in gains after strong recent momentum pushed valuation metrics to elevated levels relative to discounted cash flow models and historical multiples. With the equity pricing in aggressive growth assumptions tied to data center power management and silicon photonics initiatives, short-term institutional holders moved to reduce exposure, accelerating intraday downward volatility across the broader chip space.
Broader sentiment in the semiconductor supply chain also faced headwinds from growing market caution regarding near-term end-market demand. While structural growth drivers in physical artificial intelligence, automotive silicon carbide, and satellite communications remain sound over a multi-year horizon, near-term challenges persist in personal electronics demand and industrial component absorption. As macroeconomic uncertainty weighed on growth-oriented technology sectors, general chip-sector volatility amplified selling pressures on companies that had recently run up to premium multiples.
Investor scrutiny has increasingly centered on cost structures and margin trajectories ahead of the company's upcoming third-quarter earnings announcement. Although ongoing share buyback programs provide structural support to the capital allocation strategy, elevated manufacturing transition costs and rising input expenses continue to pose temporary margin headwinds. This combination of stretched short-term valuation, sector-level risk-off sentiment, and cautious gross margin expectations drove the intraday downward movement in the shares.
Technical Analysis of STMicroelectronics NV (STM)
Technically, STMicroelectronics NV (STM) shows a MACD (12,26,9) value of 1.579, indicating a buy signal. The RSI at 57.709 suggests neutral condition and the Williams %R at 34.630 suggests buy condition. Please monitor closely.
Fundamental Analysis of STMicroelectronics NV (STM)
STMicroelectronics NV (STM) is in the Technology Equipment industry. Its latest annual revenue is $11.80B, ranking 17 in the industry. The net profit is $166.00M, ranking 36 in the industry. Company Profile
Over the past month, multiple analysts have rated the company as Buy, with an average price target of $68.23, a high of $98.00, and a low of $26.00.
More details about STMicroelectronics NV (STM)
Company Specific Risks:
- Elevated Valuation Multiples: Trading at a trailing P/E ratio exceeding 100x compared to its historical median near 14x, the stock faces severe valuation risk and potential sharp price corrections if upcoming quarterly results fail to meet high expectations.
- Margin Compression and Integration Expenses: Squeezed net profit margins, phase-out costs, impairment charges, and integration expenses from the recent NXP MEMS sensor business acquisition continue to drag on core earnings and operating profits.
- Cyclical End-Market Demand Softness: Lingering inventory adjustments and demand weakness across key automotive and industrial semiconductor segments leave revenue recovery heavily vulnerable to broader macroeconomic headwinds.
- Free Cash Flow Constraints and Credit Outlook Exposure: Reduced free operating cash flow projections and lowered capital expenditure plans keep S&P Global Ratings' outlook on negative, creating financial leverage risks if industry recovery lags.
This article may include AI-generated content that is human-reviewed, which is for reference and general information purposes only and does not constitute investment advice.
Recommended Articles








Comments (0)
Click the $ button, enter the symbol, and select to link a stock, ETF, or other ticker.