


Citigroup Inc Stock (C) Moved Down by 3.58% on Oct 1: What Investors Need To Know



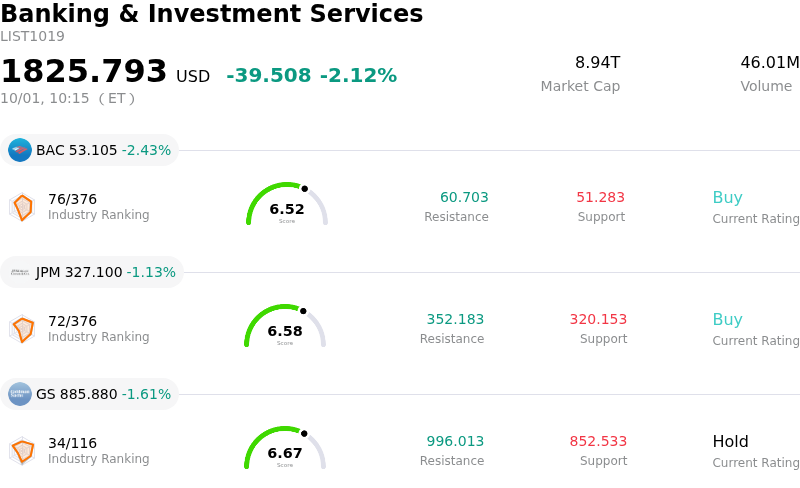
Citigroup Inc (C) moved down by 3.58%. The Banking & Investment Services sector is down by 2.12%. The company underperformed the industry. Top 3 stocks by turnover in the sector: Bank of America Corp (BAC) down 2.51%; JPMorgan Chase & Co (JPM) down 1.26%; Goldman Sachs Group Inc (GS) down 1.61%.
What is driving Citigroup Inc (C)’s stock price down today?
Citigroup experienced downside pressure and heightened intraday volatility as broader macroeconomic headwinds and sector-wide sentiment weighed on major financial institutions. Broad market selling, fueled by shifting interest rate expectations and fluctuating Treasury yields, prompted risk-off sentiment across money-center banks. As the fourth quarter opens, equity markets faced renewed volatility, leading institutional investors to reduce exposure to large-cap financials following recent market gains.
Company-specific factors also contributed to the negative price movement ahead of the bank's upcoming third-quarter earnings release. Market participants are exercising caution regarding second-half profitability metrics, particularly concerning Net Interest Income growth and credit loss provisions. While management previously raised return on tangible common equity expectations, investor anxiety remains around pulled-forward technology investments, integration costs, and potential severance charges tied to ongoing organizational restructuring. The anticipation of these near-term operational expenses has created a temporary overhang on shares despite strong core operating performance earlier in the year.
Furthermore, quarter-end and month-beginning portfolio rebalancing by institutional fund managers exacerbated intraday price fluctuations. Profit-taking in outperforming financial names has been prevalent as funds realign capital allocations. Although Citigroup continues to advance its strategic digital initiatives, including expanded global tokenization services and cryptocurrency payment partnerships, these long-term growth catalysts were overshadowed by immediate market risk aversion. The convergence of macro rate volatility, pre-earnings positioning, and short-term expense uncertainty remains the primary catalyst for the stock's temporary pullback.
Technical Analysis of Citigroup Inc (C)
Technically, Citigroup Inc (C) shows a MACD (12,26,9) value of -1.672, indicating a sell signal. The RSI at 31.977 suggests neutral condition and the Williams %R at 96.323 suggests oversold condition. Please monitor closely.
Media Coverage of Citigroup Inc (C)
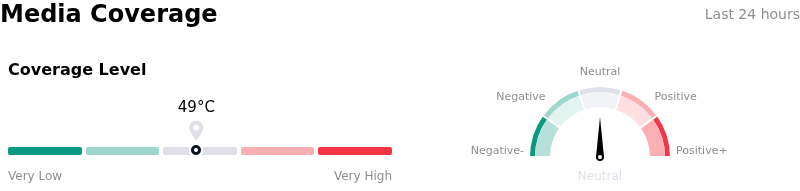
In terms of media coverage, Citigroup Inc (C) shows a coverage score of 49, indicating a moderate level of media attention. The overall market sentiment index is currently in neutral zone.
Fundamental Analysis of Citigroup Inc (C)
Citigroup Inc (C) is in the Banking & Investment Services industry. Its latest annual revenue is $81.18B, ranking 4 in the industry. The net profit is $13.02B, ranking 3 in the industry. Company Profile
Over the past month, multiple analysts have rated the company as Buy, with an average price target of $155.30, a high of $176.00, and a low of $131.69.
More details about Citigroup Inc (C)
Company Specific Risks:
- Fintech Competition & Deposit Pricing Pressures: Recent executive disclosures highlighted intensifying competition from fintech firms and AI-driven banking platforms targeting corporate and retail deposits, threatening Citigroup's net interest margin and core deposit retention.
- Elevated Tech Expense & Digital Integration Risks: Accelerated spending on multi-market instant payment networks, blockchain token services, and infrastructure modernization introduces execution risks and elevates near-term operating expenses, putting pressure on second-half efficiency ratios.
- Seasonal Trading Revenue Deceleration & Credit Losses: Institutional analysts remain concerned over a historical sequential pullback in second-half Markets trading revenue alongside potential credit quality normalization and rising net charge-offs within the U.S. consumer credit card segment.
- Complexity in Banamex Equity Divestment & Capital Allocation: Ongoing execution risks associated with the multi-step equity reduction and eventual separation of Mexico-based Banamex expose the bank to cross-border regulatory scrutiny, currency translation volatility, and uncertain share repurchasing capacity.
This article may include AI-generated content that is human-reviewed, which is for reference and general information purposes only and does not constitute investment advice.
Recommended Articles








Comments (0)
Click the $ button, enter the symbol, and select to link a stock, ETF, or other ticker.