


Pershing Square Ord Shs Stock (PS) Moved Down by 8.25% on Sep 29: What Signal Does It Send?



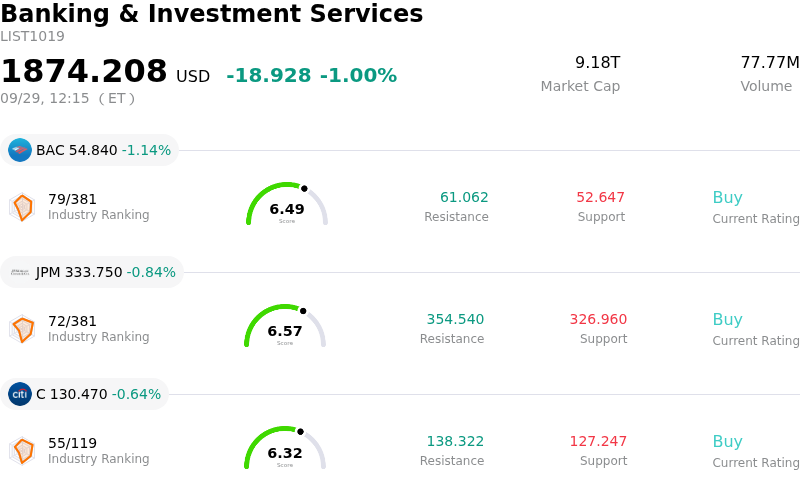
Pershing Square Ord Shs (PS) moved down by 8.25%. The Banking & Investment Services sector is down by 1.00%. The company underperformed the industry. Top 3 stocks by turnover in the sector: Bank of America Corp (BAC) down 1.14%; JPMorgan Chase & Co (JPM) down 0.84%; Citigroup Inc (C) down 0.64%.
What is driving Pershing Square Ord Shs (PS)’s stock price down today?
Pershing Square Inc. experienced a sharp downward retracement as intense profit-taking and mean-reversion pressure took hold following a rapid multi-week rally. The alternative asset manager had recently surged toward new highs on optimism surrounding the expansion of its permanent-capital platform, including the seeding of Pershing Square Ventures. However, after the stock ran up significantly in a brief timeframe, momentum investors quickly moved to lock in gains, triggering heightened intraday volatility and selling pressure across the session.
A major fundamental catalyst behind the pullback is the pronounced gap between market trading levels and institutional analyst valuations. Consensus price targets on Wall Street remain set substantially lower than recent peak prices, with the majority of research firms maintaining neutral or hold ratings. Analyst caution centers on elevated valuation multiples, including a high forward price-to-earnings ratio and a steep valuation relative to fee-generating assets under management. These valuation concerns prompted institutional investors to re-examine the stock's near-term upside relative to underlying fee income.
From a market structure perspective, the company's trading dynamics remain influenced by its relatively recent public listing and concentrated equity structure. Lower relative liquidity and average session volume tend to amplify price swings during periods of aggressive rebalancing, magnifying the downward draft when profit-taking hits the sector. Moving forward, while the firm's long-term strategy of accumulating permanent capital and launching new fee-bearing vehicles remains intact, short-term share performance will likely hinge on establishing a stable valuation base aligned with fundamental asset management earnings.
Technical Analysis of Pershing Square Ord Shs (PS)
Technically, Pershing Square Ord Shs (PS) shows a MACD (12,26,9) value of 2.861, indicating a buy signal. The RSI at 64.578 suggests neutral condition and the Williams %R at 23.405 suggests buy condition. Please monitor closely.
Fundamental Analysis of Pershing Square Ord Shs (PS)
Pershing Square Ord Shs (PS) is in the Banking & Investment Services industry. Its latest annual revenue is $348.77M, ranking 86 in the industry. The net profit is $249.78M, ranking 54 in the industry. Company Profile
Over the past month, multiple analysts have rated the company as Hold, with an average price target of $42.78, a high of $53.00, and a low of $36.00.
More details about Pershing Square Ord Shs (PS)
Company Specific Risks:
- Substantial Valuation Premium and Analyst Price Target Disconnect: Following a sudden sharp rally pushing PS stock near $60, major Wall Street brokerages maintain a consensus "Hold" rating with an average price target of $41.33 to $42.43. Analysts warn that current valuation metrics are stretched well above asset management peers, representing an immediate downside risk of nearly 30% as shares outpace fundamental fee growth.
- Extreme Portfolio Concentration and Earnings Volatility: Pershing Square’s core business model relies on a hyper-concentrated portfolio of fewer than 15 large-cap positions. This lack of diversification exposes company earnings and fee streams to heightened intraday volatility whenever single major holdings suffer operational setbacks or market pullbacks.
- Key Person Dependency Risk: Institutional research reports highlight a heavy structural reliance on founder Bill Ackman for investment strategy and capital raising. Any potential pivot, reputational hit, or reduced involvement by key leadership creates significant downside vulnerability for the firm's permanent-capital platform.
- Closed-End Capital NAV Discount Exposure: A significant portion of fee-paying assets is tied to closed-end vehicles, which historically risk trading at a persistent discount to their Net Asset Value (NAV). Adverse market sentiment or widening NAV discounts can directly suppress total assets under management (AUM) performance and sentiment surrounding fee streams.
This article may include AI-generated content that is human-reviewed, which is for reference and general information purposes only and does not constitute investment advice.
Recommended Articles







Comments (0)
Click the $ button, enter the symbol, and select to link a stock, ETF, or other ticker.