


BNB (BNBUSD) Is down 1.02% on Sep 26: Key Drivers to Watch



BNB (BNBUSD) is down 1.02% at Sep 26 16:45(ET), now at $765.8, with a 7-day up of 0.75%.
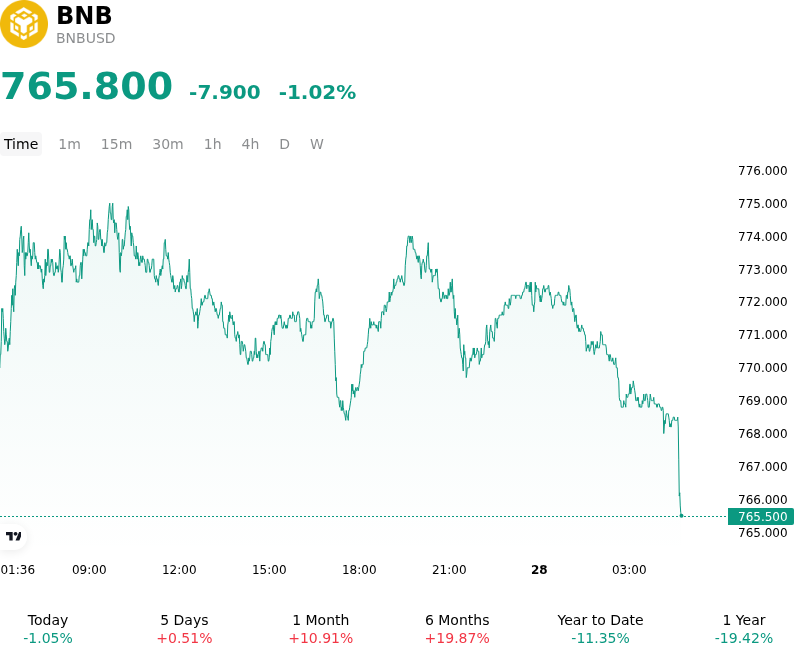
What is driving BNB (BNBUSD)’s stock price down today?
The downside retracement in BNB reflected a broader consolidation across top-tier digital assets, driven by tightening global liquidity conditions and a firming in U.S. Treasury yields. Higher bond yields exerted downward pressure on risk-sensitive assets, curbing institutional risk appetite and prompting profit-taking following a multi-week rally across the cryptocurrency market. As major market benchmarks paused near local resistance levels, capital flows into large-cap altcoins cooled, encouraging short-term tactical deleveraging.
Asset-specific market structure also played a primary role in the pull-back, as BNB encountered significant technical overhead near the critical $800 price boundary. After gaining strong upside momentum over the prior month—supported by robust on-chain activity and recent protocol upgrades on BNB Chain—the token faced concentrated supply from sellers guarding multi-month highs. The inability to clear this key psychological barrier triggered long liquidation orders in the perpetual swaps market and led short-term traders to realize profits.
Furthermore, while fundamental metrics on BNB Chain remain constructive—underpinned by growth in real-world asset tokenization and decentralized finance activity—investor sentiment continues to be calibrated against legal and regulatory scrutiny linked to its associated exchange ecosystem. Regulatory developments and enforcement headlines have maintained a residual risk premium, limiting sustained institutional buying during resistance tests. Consequently, investors elected to de-risk and rebalance positions, leaving the asset in a structural consolidation phase as market participants await clearer macroeconomic and regulatory catalysts.
Technical Analysis of BNB (BNBUSD)
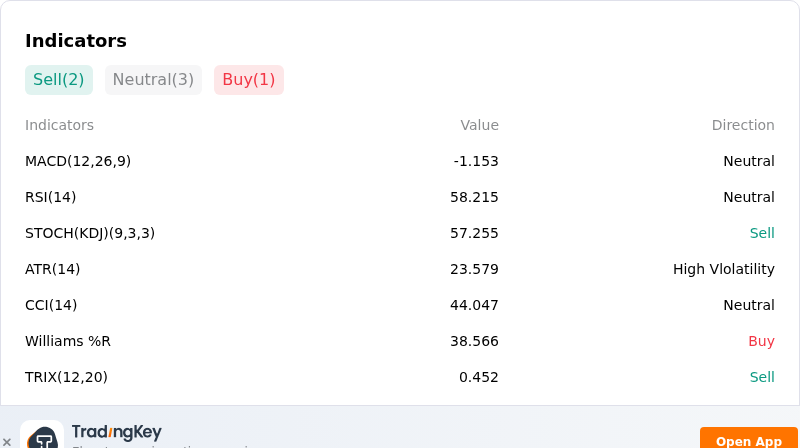
Technically, BNB (BNBUSD) shows a MACD (12,26,9) value of -1.153, indicating a neutral signal. The RSI at 58.215 suggests neutral condition and the Williams %R at 38.566 suggests buy condition. Please monitor closely.
More details about BNB (BNBUSD)
Recent Events and Risks:
- Short-Term Technical Momentum Breakdown: Intraday technical indicators on the 15-minute and 1-hour timeframes have weakened, marked by negative MACD histograms and RSI falling below 41. Rejection below the $791 daily pivot exposes BNB to near-term downside risks toward lower support levels around $760 to $740.
- Decline in On-Chain Ecosystem Transaction Fees: BNB Chain decentralized exchange activity has softened, evidenced by a 25.1% single-day drop in daily fees on PancakeSwap and a 38.8% plunge on companion DEX protocols. Decreased protocol volume reduces gas burn rates and signals cooling intraday on-chain user engagement.
- Regulatory Compliance Scrutiny and Licensing Overhang: Persistent regulatory scrutiny surrounding Binance—including renewed oversight on international sanctions compliance and ongoing hurdles in securing full EU MiCA regulatory licensing—continues to create headline-driven volatility risk and cap institutional risk appetite for BNB.
- Capital Drain via Elevated Bitcoin Market Dominance: With Bitcoin dominance holding near 58.7% alongside market-wide altcoin retracements, capital is concentrating in BTC, draining liquidity from large-cap altcoins and heightening leverage liquidation risks across BNB derivatives contracts.
This article may include AI-generated content that is human-reviewed, which is for reference and general information purposes only and does not constitute investment advice.
Recommended Articles








Comments (0)
Click the $ button, enter the symbol, and select to link a stock, ETF, or other ticker.