


Ethereum (ETHUSD) Volatility Intensified on Sep 17: What You Should Know



Ethereum (ETHUSD) is up 1.15% at Sep 17 21:30(ET), now at $2436.28, with a 7-day down of 0.94%.
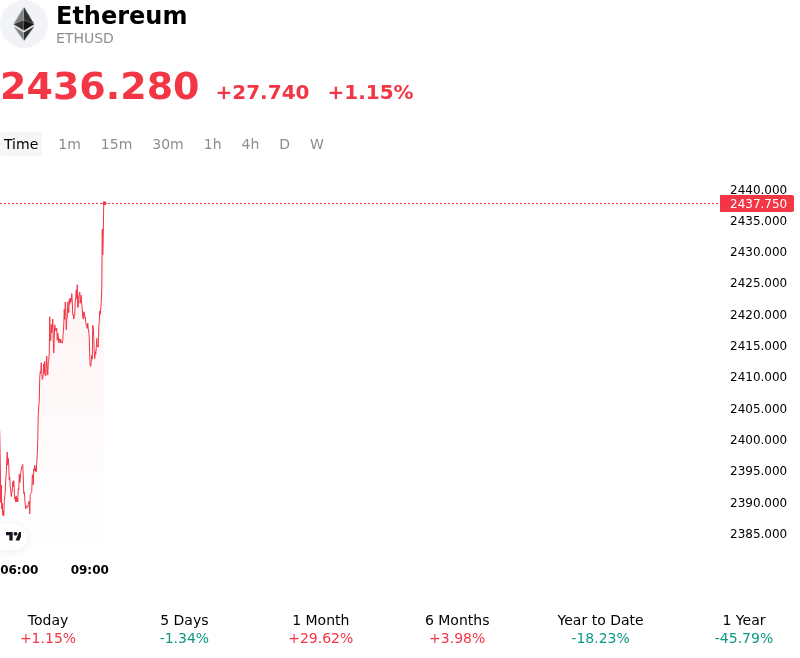
What is driving Ethereum (ETHUSD)’s stock price up today?
Following the resolution of the Federal Reserve’s monetary policy announcement, Ethereum experienced a relief bounce as macro uncertainty receded. While central bank communications maintained a data-dependent stance, market participants treated the event as a tactical opportunity to rebuild exposure. The preceding wash-out of overleveraged positions in the derivatives market effectively cleared excess speculative open interest, creating a cleaner structural backdrop for spot demand to re-emerge. As forced liquidations subsided and order-book depth stabilized near key technical support zones, short-covering and dip-buying capital triggered a steady intraday price appreciation.
Underlying on-chain dynamics played a central role in sustaining the price recovery. Continued net withdrawals from centralized exchanges significantly reduced readily available market float, creating a supply-side buffer against broader macro tightening. On-chain data indicated structural accumulation by institutional entities and non-exchange addresses, alongside ongoing staking lockups, which served to compress circulating liquid supply. Although spot Ethereum ETF flows showed mixed activity across primary market issuers during surrounding sessions, long-term treasury allocations and corporate balance sheet purchases provided consistent price floors.
Looking ahead, the movement represents a tactical event-driven rebound following a period of macro-induced de-risking and derivative unwinding. While elevated Treasury yields and unresolved regulatory frameworks continue to pose headwinds for high-beta digital assets, Ethereum's structural network supply contraction and resilient layer-two transaction volume maintain a constructive baseline for medium-term institutional adoption. Investors remain focused on central bank forward guidance and spot ETF capital trends as key indicators for sustained trend continuation.
Technical Analysis of Ethereum (ETHUSD)
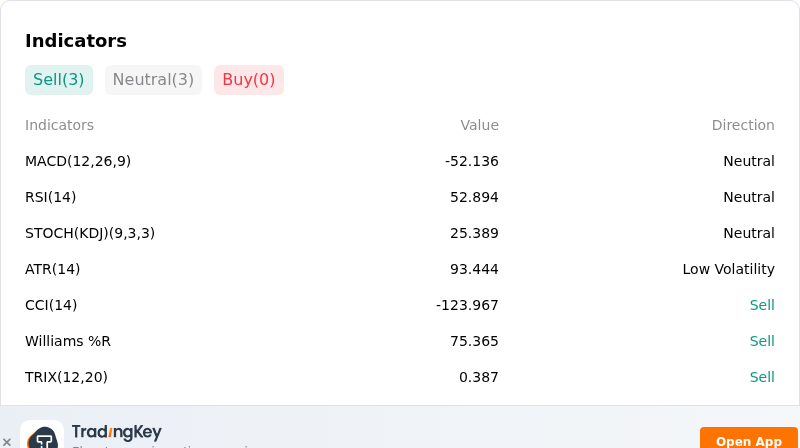
Technically, Ethereum (ETHUSD) shows a MACD (12,26,9) value of -52.136, indicating a neutral signal. The RSI at 52.894 suggests neutral condition and the Williams %R at 75.365 suggests sell condition. Please monitor closely.
More details about Ethereum (ETHUSD)
Recent Events and Risks:
- U.S. Legislative Regulatory Setback: The failure of the U.S. Senate to advance the CLARITY Act in a 49–50 vote removed expected regulatory market structure clarity, sparking immediate risk-off selling that pushed Ethereum below key support at $2,400.
- Surge in Spot ETF Capital Outflows: U.S. spot Ethereum ETFs experienced a sharp reversal in institutional demand, recording $142.3 million in net daily outflows on September 15—led by $98 million in withdrawals from BlackRock's ETHA—marking one of the deepest daily institutional capital exits in months.
- Derivatives Liquidation Cascade: The regulatory pull-back triggered a forced de-leveraging event across derivatives markets, wiping out over $570 million in long positions and creating a liquidity vacuum in ETH perpetual futures that leaves market structure vulnerable to further intraday spikes in volatility.
- Macroeconomic Policy Pressure and Technical Downside: Hawkish Federal Reserve interest rate guidance and broader tightening in global monetary conditions are dampening demand for risk assets, threatening a further breakdown toward secondary support near the $2,266 EMA if spot buying fails to absorb ongoing retail distribution.
This article may include AI-generated content that is human-reviewed, which is for reference and general information purposes only and does not constitute investment advice.
Recommended Articles












Comments (0)
Click the $ button, enter the symbol, and select to link a stock, ETF, or other ticker.