


Gold Fields Ltd Stock (GFI) Closed Up by 7.21% on Sep 3: Drivers Behind the Movement



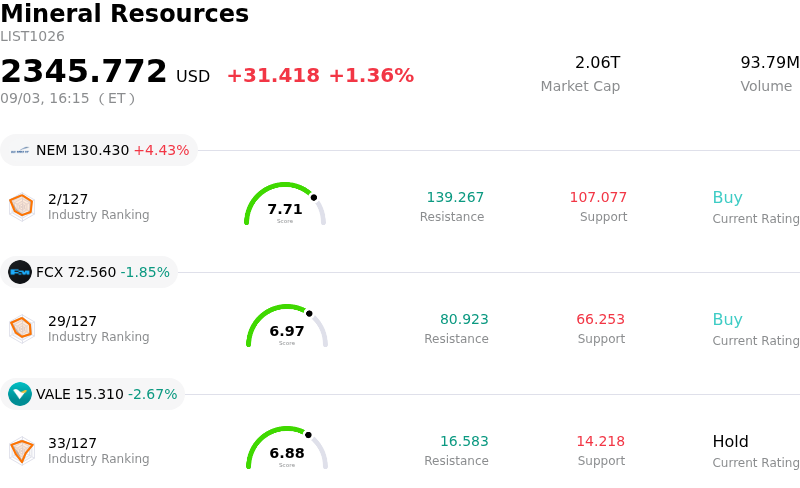
Gold Fields Ltd (GFI) closed up by 7.21%. The Mineral Resources sector is up by 1.36%. The company outperformed the industry. Top 3 stocks by turnover in the sector: Newmont Corporation (NEM) up 4.43%; Freeport-McMoRan Inc (FCX) down 1.85%; Vale SA (VALE) down 2.67%.
What is driving Gold Fields Ltd (GFI)’s stock price up today?
The sharp upward momentum in Gold Fields Limited shares reflects a combination of macroeconomic tailwinds and heightened sector-wide interest across precious metals producers. As global bullion prices remain supported by central bank reserve diversification and broader macroeconomic uncertainties, investor appetite for major gold miners has intensified. Strong underlying commodity prices have significantly expanded mining cash margins, positioning large-scale multi-asset producers like Gold Fields as prime vehicles for precious metals exposure.
Company-specific operational updates have further bolstered investor confidence. Gold Fields recently reported robust first-half financial performance, characterized by substantial year-over-year earnings growth and a notable surge in adjusted free cash flow generation. Operational outperformance at the key Salares Norte asset in Chile has effectively countered localized production headwinds in other operational regions, allowing management to reaffirm full-year gold production targets toward the upper bound of its guidance range. Concurrently, a disciplined capital allocation strategy and lowered full-year capital expenditure expectations have reassured the market regarding cost management and free cash flow visibility.
Enhancing the investment narrative, Gold Fields announced a generous interim dividend payout alongside an expanded shareholder return program, supported by significant net debt reduction. This aggressive return of capital, coupled with technical buy signals and institutional position adjustments, triggered strong intraday volatility and buying demand. While investors continue to monitor operational cost inflation and development timelines for key expansion projects, the current rally highlights market enthusiasm for the company's elevated profitability and shareholder-friendly capital distribution policy.
Technical Analysis of Gold Fields Ltd (GFI)
Technically, Gold Fields Ltd (GFI) shows a MACD (12,26,9) value of -0.237, indicating a neutral signal. The RSI at 66.688 suggests neutral condition and the Williams %R at 11.204 suggests overbought condition. Please monitor closely.
Fundamental Analysis of Gold Fields Ltd (GFI)
Gold Fields Ltd (GFI) is in the Mineral Resources industry. Its latest annual revenue is $8.75B, ranking 21 in the industry. The net profit is $3.57B, ranking 7 in the industry. Company Profile
Over the past month, multiple analysts have rated the company as Buy, with an average price target of $46.50, a high of $57.00, and a low of $39.00.
More details about Gold Fields Ltd (GFI)
Company Specific Risks:
- Institutional Analyst Downgrades: Wall Street Zen downgraded Gold Fields from Buy to Hold, while Scotiabank, RBC, and JPMorgan trimmed their price targets, sparking institutional profit-taking following the stock's recent post-earnings rally.
- Windfall Project Permitting Delays: Approval for the Environmental Impact Assessment at the Canadian Windfall project has suffered multi-month delays, creating execution risks that could push the project's development timeline back to late 2029 if approvals are not secured by year-end.
- Regulatory Lease Renewal Uncertainty in Ghana: Management highlighted significant regulatory exposure regarding ongoing negotiations with the government of Ghana to renew essential mining leases for the Tarkwa operation, noting that final terms and timelines remain uncertain.
- Mine-Level Operational Bottlenecks and Cost Pressures: Individual assets including Gruyere and Tarkwa face risks of missing mine-level targets, while group All-In Sustaining Costs rose 13% year-over-year to $1,893 per ounce due to royalty increases and currency inflation.
This article may include AI-generated content that is human-reviewed, which is for reference and general information purposes only and does not constitute investment advice.
Recommended Articles








Comments (0)
Click the $ button, enter the symbol, and select to link a stock, ETF, or other ticker.