


Figma Inc Stock (FIG) Closed Up by 13.28% on Aug 27: Key Drivers Unveiled



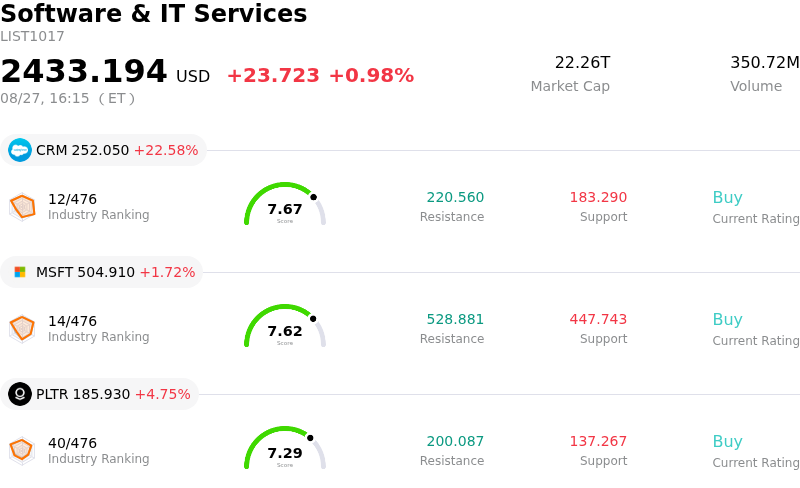
Figma Inc (FIG) closed up by 13.28%. The Software & IT Services sector is up by 0.98%. The company outperformed the industry. Top 3 stocks by turnover in the sector: Salesforce Inc (CRM) up 22.58%; Microsoft Corp (MSFT) up 1.72%; Palantir Technologies Inc (PLTR) up 4.75%.
What is driving Figma Inc (FIG)’s stock price up today?
Figma experienced a substantial upward price move accompanied by heightened intraday volatility as a sector-wide rally swept across application software and design platforms. Investors increasingly unwound earlier market concerns that generative artificial intelligence would cannibalize seat counts and erode pricing power for incumbent creative software vendors. Instead, sentiment pivoted toward viewing embedded AI functionality as a structural tailwind capable of driving monetization and broadening the company's addressable market. This broader sector relief rally triggered robust buying interest across software laggards, with Figma leading gains as short sellers covered positions and growth-oriented institutions expanded exposure.
The intraday momentum was further anchored by sustained digestion of Figma's recent quarterly financial performance and upgraded forward outlook. The company previously reported accelerating top-line expansion, topping consensus expectations on both revenue and earnings per share while raising full-year revenue guidance to a range between $1.463 billion and $1.467 billion. Key underlying operating metrics demonstrated that enterprise customers are actively adopting and monetizing Figma's generative AI tools. A significant majority of high-value account holders have incorporated AI features into their weekly product development workflows, reinforcing market confidence that the platform is successfully transitioning into an integrated, AI-driven software creation ecosystem.
From a market structure perspective, the sharp advance reflects a valuation re-rating following a prolonged period of downside pressure. Recent Wall Street research reports underscored a growing divergence between the company's top-line growth acceleration and its compressed valuation multiples relative to industry peers. Driven by constructive analyst target revisions and improving risk-reward parameters, institutional capital re-engaged, propelling elevated trading volume and volatility as buyers capitalized on the setup.
Technical Analysis of Figma Inc (FIG)
Technically, Figma Inc (FIG) shows a MACD (12,26,9) value of 0.512, indicating a buy signal. The RSI at 67.871 suggests neutral condition and the Williams %R at 7.016 suggests overbought condition. Please monitor closely.
Fundamental Analysis of Figma Inc (FIG)
Figma Inc (FIG) is in the Software & IT Services industry. Its latest annual revenue is $1.06B, ranking 184 in the industry. The net profit is $-1.25B, ranking 604 in the industry. Company Profile
Over the past month, multiple analysts have rated the company as Buy, with an average price target of $33.61, a high of $52.45, and a low of $25.00.
More details about Figma Inc (FIG)
Company Specific Risks:
- Surging AI Infrastructure Costs and Margin Compression: Accelerating expenditure on AI inference capacity and enterprise go-to-market expansion has severely compressed gross margins and driven GAAP operating losses past $117 million, creating friction around long-term unit economics.
- Persistent Executive Insider Selling and Stock Dilution: SEC Form 4 and Form 144 filings over recent sessions highlight continuous pre-planned share liquidations by key corporate officers and affiliated trusts, compounding investor anxiety over high stock-based compensation and ongoing share dilution.
- Elevated Valuation Multiple and Volatility Risk: Trading at roughly 11x trailing sales and a forward P/E near 90x alongside elevated short interest, the stock exhibits extreme intraday volatility and heightened sensitivity to software sector de-risking and rising Treasury yields.
- Intensifying AI-Native Software Competition: Institutional analysis continues to emphasize competitive pressure from legacy players like Adobe and emerging AI-native coding and UI design tools, which threatens to erode Figma's pricing power and long-term platform moat.
This article may include AI-generated content that is human-reviewed, which is for reference and general information purposes only and does not constitute investment advice.
Recommended Articles









Comments (0)
Click the $ button, enter the symbol, and select to link a stock, ETF, or other ticker.