


Canadian Imperial Bank of Commerce Stock (CM) Moved Down by 3.40% on Aug 27: Drivers Behind the Movement



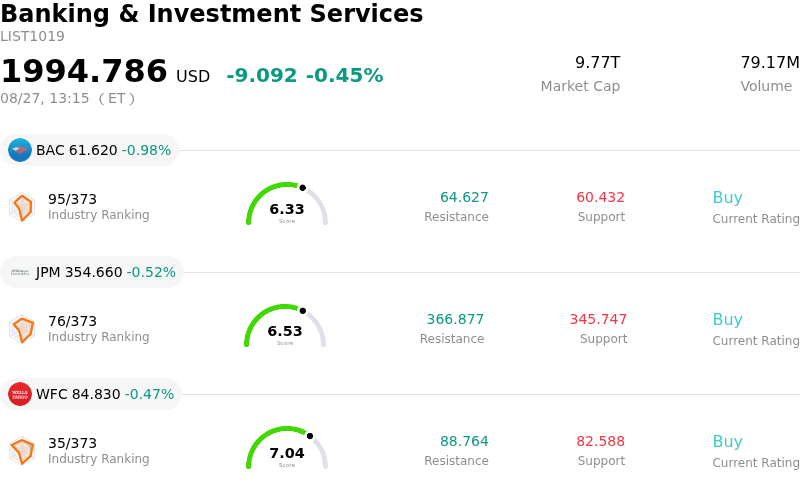
Canadian Imperial Bank of Commerce (CM) moved down by 3.40%. The Banking & Investment Services sector is down by 0.45%. The company underperformed the industry. Top 3 stocks by turnover in the sector: Bank of America Corp (BAC) down 1.00%; JPMorgan Chase & Co (JPM) down 0.52%; Wells Fargo & Co (WFC) down 0.50%.
What is driving Canadian Imperial Bank of Commerce (CM)’s stock price down today?
Canadian Imperial Bank of Commerce experienced notable downward pressure and intraday volatility following the release of its third-quarter fiscal 2026 financial results. Although the bank demonstrated strong top-line revenue momentum driven by solid capital markets trading activity and margin expansion in its core Canadian retail segment, market sentiment was negatively impacted by one-off divestment charges, elevated operating costs, and sequential margin compression in key business units.
The primary catalyst behind the selling pressure was a pre-tax charge of $269 million ($232 million after tax) related to the announced sale of CIBC Caribbean Bank Limited. This item hit reported net income and reduced reported earnings per share by $0.26, contributing to a quarter-over-quarter decline in reported profit and putting temporary downward pressure on the bank's Common Equity Tier 1 capital ratio. Beyond the transaction charge, total operating expenses expanded year-over-year, propelled by higher performance-linked employee compensation, ongoing strategic technology investments, and marketing initiatives.
Segment performance also revealed localized margin headwinds. While Canadian personal and commercial banking delivered healthy net interest margin gains, the U.S. commercial banking and wealth management segment saw its net interest margin contract sequentially due to pricing pressures and shifts in product mix. Furthermore, management highlighted ongoing macro uncertainties, including intense deposit competition and a slower economic background in Canadian housing, which tempered forward expectations.
With the stock entering the earnings release near the upper bound of its 52-week price range, the combination of elevated operating expenses, Caribbean divestment headwinds, and segment-specific margin compression prompted institutional profit-taking, leading to increased trading volatility.
Technical Analysis of Canadian Imperial Bank of Commerce (CM)
Technically, Canadian Imperial Bank of Commerce (CM) shows a MACD (12,26,9) value of -1.432, indicating a neutral signal. The RSI at 40.408 suggests neutral condition and the Williams %R at 87.955 suggests oversold condition. Please monitor closely.
Fundamental Analysis of Canadian Imperial Bank of Commerce (CM)
Canadian Imperial Bank of Commerce (CM) is in the Banking & Investment Services industry. Its latest annual revenue is $20.50B, ranking 29 in the industry. The net profit is $5.78B, ranking 23 in the industry. Company Profile
Over the past month, multiple analysts have rated the company as Buy, with an average price target of $128.87, a high of $129.73, and a low of $128.00.
More details about Canadian Imperial Bank of Commerce (CM)
Company Specific Risks:
- Divestiture Charges and GAAP Earnings Miss: In its Q3 2026 financial results released on August 27, 2026, CIBC reported GAAP diluted EPS of $2.47, missing the average analyst forecast of $2.53. The earnings miss was largely driven by a $269 million pre-tax ($232 million after-tax) charge associated with the announced sale of CIBC Caribbean Bank Limited.
- Sequential CET1 Capital Ratio Erosion: The bank's Common Equity Tier 1 (CET1) capital ratio contracted by 20 basis points quarter-over-quarter, dropping from 13.6% in Q2 2026 to 13.4% as of July 31, 2026. This decline highlights organic capital generation being offset by Caribbean restructuring charges, minor investments, and ongoing share repurchases.
- Increasing Impaired Loan Provisions: Provisions on impaired loans expanded quarter-over-quarter to $612 million (a $64 million sequential increase), triggered by specific credit defaults within the Canadian commercial banking and capital markets portfolios. Management noted elevated exposure to macroeconomic risks, geopolitical friction, and potential cross-border trade tensions.
- Rising Non-Interest Operating Expenses: Non-interest operating expenses surged 11% year-over-year during the third quarter. The elevated cost structure was primarily driven by higher employee compensation, revenue-linked incentive payouts, and heavy ongoing investments in technology infrastructure and enterprise AI initiatives.
This article may include AI-generated content that is human-reviewed, which is for reference and general information purposes only and does not constitute investment advice.
Recommended Articles









Comments (0)
Click the $ button, enter the symbol, and select to link a stock, ETF, or other ticker.