


Novo Nordisk A/S Stock (NVO) Closed Up by 3.71% on Aug 25: A Full Analysis



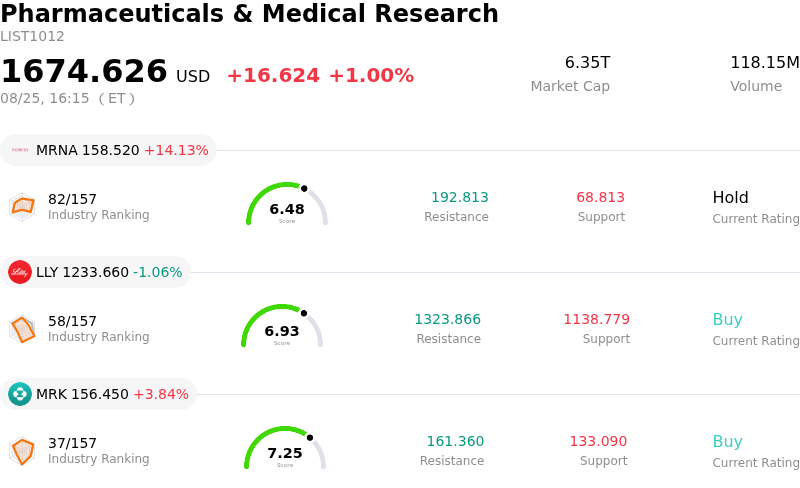
Novo Nordisk A/S (NVO) closed up by 3.71%. The Pharmaceuticals & Medical Research sector is up by 1.00%. The company outperformed the industry. Top 3 stocks by turnover in the sector: Moderna Inc (MRNA) up 14.13%; Eli Lilly and Co (LLY) down 1.06%; Merck & Co Inc (MRK) up 3.84%.
What is driving Novo Nordisk A/S (NVO)’s stock price up today?
Novo Nordisk experienced a notable upward trajectory driven primarily by bullish Wall Street research coverage. A major investment bank raised its price target and revised higher its sales and earnings projections for the company through 2026 and beyond. Wall Street analysts highlighted stronger-than-expected international adoption of Wegovy, limited generic erosion threats for Ozempic, and favorable second-quarter U.S. gross-to-net price adjustments as key catalysts driving the upward revisions in long-term financial forecasts.
The positive sentiment is further reinforced by the fundamental resilience of Novo Nordisk's core GLP-1 obesity and diabetes therapies. Following better-than-expected second-quarter financial results, momentum across both international and domestic markets continues to demonstrate robust underlying volume growth. Additionally, the company's active share buyback program provides consistent buying demand and capital return to shareholders, helping bolster market confidence and support stock price stability amid broader industry volatility.
Market sentiment toward the pharmaceutical giant appears to be shifting toward recovery as concerns regarding market share competition with key rivals begin to stabilize. Investors are increasingly focusing on Novo Nordisk's attractive relative valuation and upcoming pipeline milestones, including next-generation metabolic candidates like CagriSema. The combination of analyst target upgrades, strong commercial execution in global markets, and ongoing corporate share repurchases has created strong intraday buying pressure, propelling the stock higher.
Technical Analysis of Novo Nordisk A/S (NVO)
Technically, Novo Nordisk A/S (NVO) shows a MACD (12,26,9) value of 0.438, indicating a neutral signal. The RSI at 58.710 suggests neutral condition and the Williams %R at 0.000 suggests overbought condition. Please monitor closely.
Fundamental Analysis of Novo Nordisk A/S (NVO)
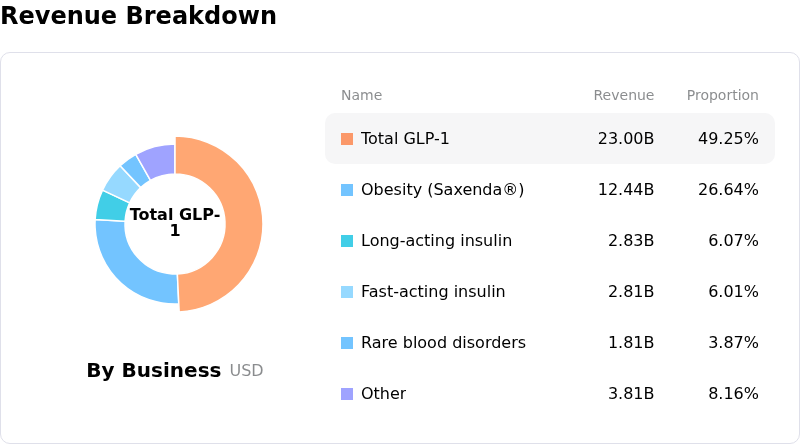
Novo Nordisk A/S (NVO) is in the Pharmaceuticals & Medical Research industry. Its latest annual revenue is $46.70B, ranking 12 in the industry. The net profit is $15.48B, ranking 4 in the industry. Company Profile
Over the past month, multiple analysts have rated the company as Hold, with an average price target of $50.50, a high of $65.00, and a low of $40.00.
More details about Novo Nordisk A/S (NVO)
Company Specific Risks:
- Oral Wegovy Adoption Bottlenecks: Recent institutional analyst updates from J.P. Morgan lowered U.S. Oral Wegovy sales projections by 11%, highlighting slower-than-anticipated domestic prescription growth and reduced near-term momentum for the oral obesity franchise.
- Drastic Pricing Pressure and Margin Compression: Imminent list price cuts of up to 50% for Wegovy and 35% for Ozempic, compounded by anticipated U.S. Inflation Reduction Act price controls, pose severe structural threats to average selling prices and long-term gross margins.
- Competitive Market Share Erosion: Rapid adoption of Eli Lilly's competing GLP-1 therapies (Zepbound and Mounjaro) continues to erode Novo Nordisk's market dominance, dampening U.S. revenue expansion and forcing aggressive defensive pricing tactics.
- Contracting Annual Growth and Asset Impairments: Full-year corporate financial guidance anticipates revenue and operating profit trends ranging between 0% and -6% at constant exchange rates, weighed down further by a 4.0 billion DKK write-down on pipeline assets such as monlunabant.
This article may include AI-generated content that is human-reviewed, which is for reference and general information purposes only and does not constitute investment advice.
Recommended Articles









Comments (0)
Click the $ button, enter the symbol, and select to link a stock, ETF, or other ticker.