


Merck & Co Inc Stock (MRK) Moved Up by 3.76% on Aug 25: A Full Analysis



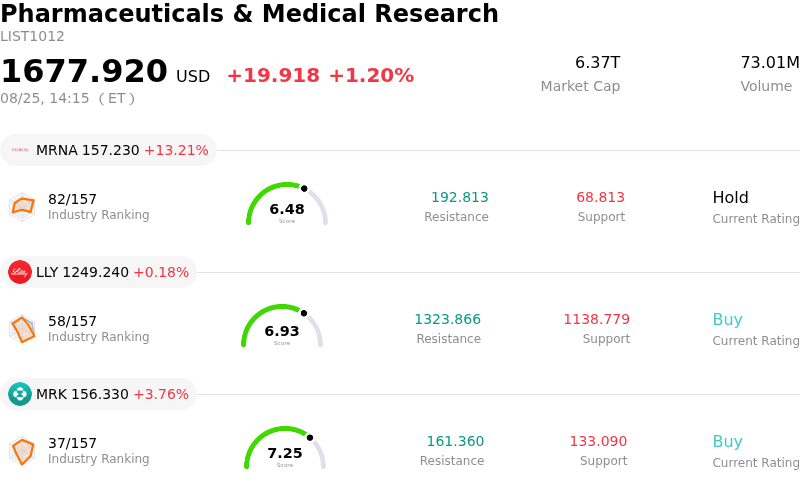
Merck & Co Inc (MRK) moved up by 3.76%. The Pharmaceuticals & Medical Research sector is up by 1.20%. The company outperformed the industry. Top 3 stocks by turnover in the sector: Moderna Inc (MRNA) up 13.21%; Eli Lilly and Co (LLY) up 0.18%; Merck & Co Inc (MRK) up 3.76%.
What is driving Merck & Co Inc (MRK)’s stock price up today?
Merck experienced strong upward momentum during the trading session, driven primarily by a wave of bullish research note revisions across major Wall Street institutions. Financial analysts, including teams at Wolfe Research and Argus, raised their price targets on the company while maintaining outperformance and buy ratings. Institutional research highlighted growing confidence in the pharmaceutical giant's underlying cash flow trajectory, solid earnings execution, and long-term valuation upside, which spurred strong buying interest throughout the session.
A key underlying driver for the renewed market enthusiasm is the milestone trial data from Merck's high-profile oncology partnership with Moderna. Late-stage trial results from the INTerpath-001 study demonstrated that their personalized mRNA cancer therapy, when paired with Merck's flagship drug Keytruda, significantly improved recurrence-free survival rates in high-risk melanoma patients. Investors view this clinical success as a crucial proof-of-concept for mRNA-based cancer treatments and a key lever for extending Keytruda's market leadership, helping alleviate long-term concerns regarding upcoming patent expirations.
Complementing the clinical breakthroughs is Merck's solid fundamental performance, anchored by recent quarterly results that topped consensus revenue and earnings estimates alongside raised full-year guidance. Despite broader headline noise surrounding legal challenges to government drug pricing programs, market sentiment remained firmly constructive. Robust institutional ownership and sustained demand for high-quality, dividend-paying healthcare assets provided a supportive backdrop, allowing the stock to attract consistent inflows.
Technical Analysis of Merck & Co Inc (MRK)
Technically, Merck & Co Inc (MRK) shows a MACD (12,26,9) value of 4.448, indicating a buy signal. The RSI at 77.763 suggests buy condition and the Williams %R at 0.167 suggests overbought condition. Please monitor closely.
Media Coverage of Merck & Co Inc (MRK)
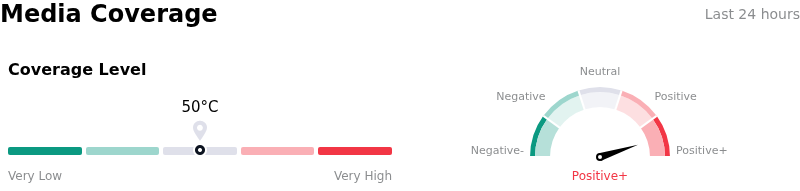
In terms of media coverage, Merck & Co Inc (MRK) shows a coverage score of 50, indicating a moderate level of media attention. The overall market sentiment index is currently in extremely bullish zone.
Fundamental Analysis of Merck & Co Inc (MRK)
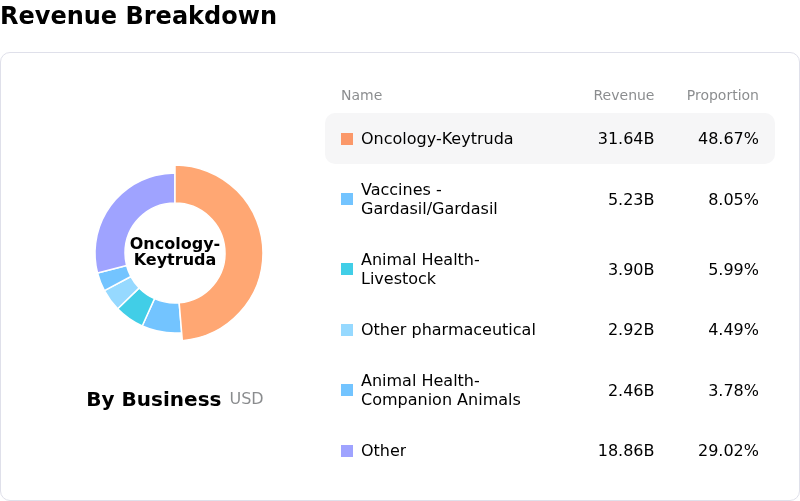
Merck & Co Inc (MRK) is in the Pharmaceuticals & Medical Research industry. Its latest annual revenue is $65.01B, ranking 5 in the industry. The net profit is $18.25B, ranking 3 in the industry. Company Profile
Over the past month, multiple analysts have rated the company as Buy, with an average price target of $144.88, a high of $186.00, and a low of $95.00.
More details about Merck & Co Inc (MRK)
Company Specific Risks:
- Sell-Side Downgrades and Valuation Compression: Following a rapid stock rally to 52-week highs near $155 per share, Wall Street firms including RBC Capital downgraded the stock to Sector Perform, cautioning that near-term optimism over melanoma trial data overextended valuation multiples—leaving shares at a ~25% premium to intrinsic GF Value estimates and triggering intraday profit-taking.
- Substantial EPS Guidance Cut from M&A Charges: Recent SEC Form 8-K disclosures confirmed a severe reduction in full-year 2026 non-GAAP EPS guidance to $2.66–$2.76 (down from $5.04–$5.16) due to $14.7 billion in upfront R&D accounting charges from the Terns Pharmaceuticals ($5.7B) and Cidara Therapeutics ($9.0B) acquisitions, which swung Q2 into a net loss and inflated full-year tax rates to 35%–36%.
- Imminent Keytruda Patent Cliff and Revenue Concentration: Institutional analysts highlight structural long-term downside stemming from heavy top-line dependence on Keytruda, which faces loss of U.S. patent exclusivity in 2028 and creates an estimated $23 billion revenue cliff that unproven pipeline assets may fail to fully replace.
- Executive Insider Share Dispositions: Recent SEC Form 4 filings revealed substantial insider selling among senior corporate leadership, highlighted by Executive Vice President Jennifer Zachary liquidating 80,315 shares for $10.7 million (a 63.8% reduction in her position), adding downward pressure on market sentiment.
This article may include AI-generated content that is human-reviewed, which is for reference and general information purposes only and does not constitute investment advice.
Recommended Articles








Comments (0)
Click the $ button, enter the symbol, and select to link a stock, ETF, or other ticker.