


Interactive Brokers Group Inc Stock (IBKR) Moved Up by 3.96% on Aug 25: Drivers Behind the Movement



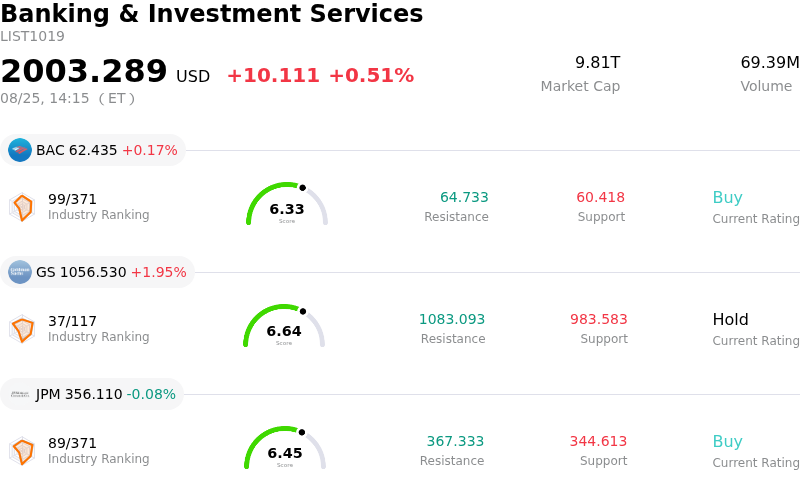
Interactive Brokers Group Inc (IBKR) moved up by 3.96%. The Banking & Investment Services sector is up by 0.51%. The company outperformed the industry. Top 3 stocks by turnover in the sector: Bank of America Corp (BAC) up 0.17%; Goldman Sachs Group Inc (GS) up 1.95%; JPMorgan Chase & Co (JPM) down 0.08%.
What is driving Interactive Brokers Group Inc (IBKR)’s stock price up today?
Interactive Brokers Group experienced strong upward price momentum primarily driven by the announcement of a strategic partnership with South Korea based Daol Investment and Securities. Under this collaboration, eligible South Korean investors will gain direct access to global equity markets through Daol's platform by utilizing Interactive Brokers advanced brokerage technology. This alliance strengthens the company's introducing broker and white-label capabilities in the Asia-Pacific region, expanding its global footprint and positioning it to capture rising cross-border trading volume and commission revenues.
The momentum was further reinforced by continuous efforts to broaden its international footprint and institutional offerings. Recent platform upgrades, including expanded funding choices for Latin American clients, access to new European exchanges, and derivative offerings in emerging markets, underscore the firm's aggressive global market capture. Coupled with strong underlying metrics in active account acquisition, elevated daily average revenue trades, and expanding customer equity, Interactive Brokers continues to demonstrate exceptional operating leverage given its highly automated execution architecture.
Positive investor sentiment and favorable market coverage also contributed to the buying interest. Analysts and institutional investors continue to view the company as a premier fintech growth player within capital markets, supported by its high margin model and low capital requirements for platform scaling. Despite discussions surrounding valuation multiples, the firm's consistent record of outperforming operational expectations and securing global institutional partnerships provided strong support for the stock's gains.
Technical Analysis of Interactive Brokers Group Inc (IBKR)
Technically, Interactive Brokers Group Inc (IBKR) shows a MACD (12,26,9) value of 1.219, indicating a buy signal. The RSI at 60.949 suggests neutral condition and the Williams %R at 0.000 suggests overbought condition. Please monitor closely.
Media Coverage of Interactive Brokers Group Inc (IBKR)
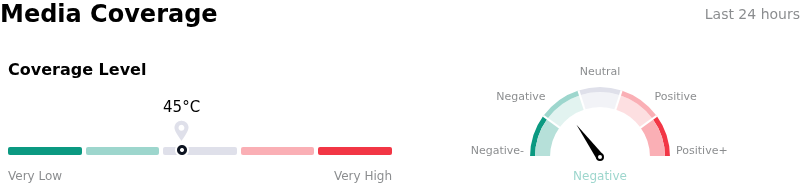
In terms of media coverage, Interactive Brokers Group Inc (IBKR) shows a coverage score of 45, indicating a moderate level of media attention. The overall market sentiment index is currently in bearish zone.
Fundamental Analysis of Interactive Brokers Group Inc (IBKR)
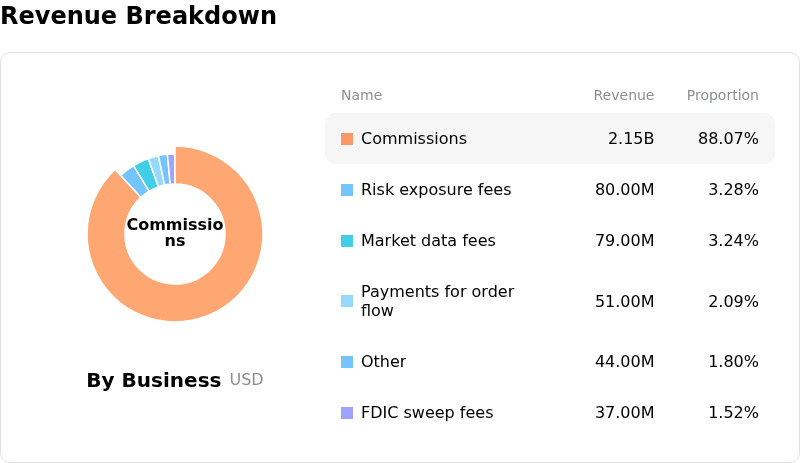
Interactive Brokers Group Inc (IBKR) is in the Banking & Investment Services industry. Its latest annual revenue is $10.00B, ranking 24 in the industry. The net profit is $984.00M, ranking 24 in the industry. Company Profile
Over the past month, multiple analysts have rated the company as Buy, with an average price target of $106.31, a high of $121.00, and a low of $72.18.
More details about Interactive Brokers Group Inc (IBKR)
Company Specific Risks:
- Severe Valuation Multiple Drag: Interactive Brokers trades at an elevated trailing price-to-earnings multiple of over 36x, vastly exceeding its 5-year median of 21.6x and intrinsic fair value models, creating extreme downside vulnerability to intraday multiple contraction.
- Sensitivity to Lower Net Interest Income: The brokerage relies heavily on yield earned from over $930 billion in customer assets and margin lending, leaving core profitability acutely vulnerable to margin compression as macroeconomic interest rate cuts materialize.
- Persistent Executive Insider Disinvestment: Corporate filings reveal substantial net insider equity selling totaling over $99 million over the past year with zero insider purchases, signaling top-level caution regarding valuation sustainability and dampening institutional investor sentiment.
- Pretax Operating Margin Erosion: Analyst updates flag rising operational costs and non-recurring administrative expenses that have pushed pretax profit margins down to 71.5%, threatening Interactive Brokers' historical operating leverage despite ongoing client account growth.
This article may include AI-generated content that is human-reviewed, which is for reference and general information purposes only and does not constitute investment advice.
Recommended Articles









Comments (0)
Click the $ button, enter the symbol, and select to link a stock, ETF, or other ticker.