


XCHG Ltd Stock (XCH) Moved Down by 7.05% on Aug 25: What Signal Does It Send?



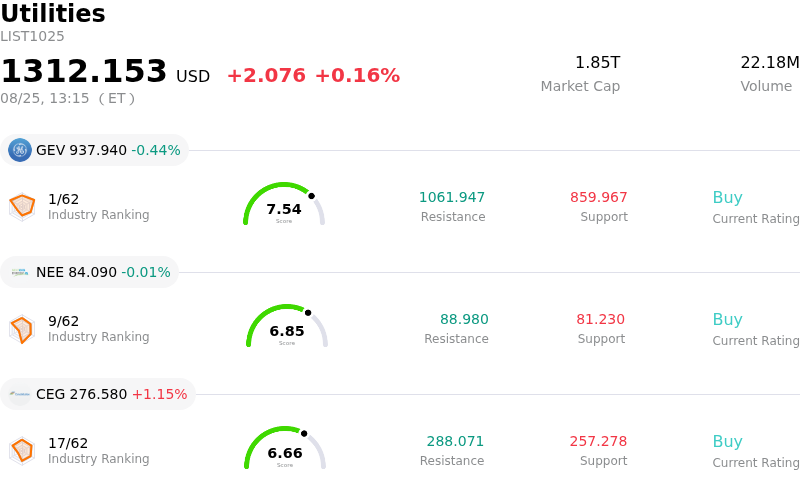
XCHG Ltd (XCH) moved down by 7.05%. The Utilities sector is up by 0.16%. The company underperformed the industry. Top 3 stocks by turnover in the sector: Ge Vernova Inc (GEV) down 0.44%; Nextera Energy Inc (NEE) down 0.07%; Constellation Energy Corp (CEG) up 1.15%.
What is driving XCHG Ltd (XCH)’s stock price down today?
XCHG Limited experienced downward pressure and heightened intraday volatility as market participants continued to digest the company's recent structural capital adjustment. The electric vehicle charging solutions provider recently executed a reverse split of its American Depositary Shares to maintain compliance with Nasdaq minimum bid price requirements. While reverse stock splits artificially consolidate share counts to satisfy listing criteria, they frequently induce post-effective trading volatility and selling pressure. Investors often interpret these adjustments as signals of underlying operational distress, leading to increased position adjustments and technical selling.
Underpinning the weakness are ongoing fundamental challenges across XCHG's core business model. Despite expanding its product line in high-power DC fast chargers and battery-integrated energy storage systems, the company continues to navigate persistent net losses, cash burn, and elevated operating expenses. Previous share-dilutive direct offerings and executive equity vestings have further weighed on market sentiment. In an environment where investors are increasingly prioritizing cash-flow visibility over speculative growth, capital-intensive equipment makers in the EV infrastructure sector face persistent valuation headwinds.
Looking ahead, the equity's performance will depend heavily on management's execution in scaling its North American and European footprints while establishing a path toward sustainable margins. Until XCHG can demonstrate meaningful operational stabilization and consistent revenue realization, the stock is expected to remain vulnerable to elevated volatility driven by low trading liquidity and broader micro-cap industrial sector swings.
Technical Analysis of XCHG Ltd (XCH)
Technically, XCHG Ltd (XCH) shows a MACD (12,26,9) value of 0.162, indicating a neutral signal. The RSI at 24.303 suggests sell condition and the Williams %R at 95.652 suggests oversold condition. Please monitor closely.
Fundamental Analysis of XCHG Ltd (XCH)
XCHG Ltd (XCH) is in the Utilities industry. Its latest annual revenue is $25.10M, ranking 68 in the industry. The net profit is $-32.50M, ranking 66 in the industry. Company Profile
Over the past month, multiple analysts have rated the company as , with an average price target of $0.00, a high of $0.00, and a low of $0.00.
More details about XCHG Ltd (XCH)
Company Specific Risks:
- Reverse ADS Split Execution: XCHG Limited implemented a 1-for-20 reverse American Depositary Share (ADS) split following a temporary trading halt. Such corporate restructurings reflect severe equity price degradation and typically trigger post-split selling pressure and erratic intraday price fluctuations.
- Nasdaq Listing Non-Compliance: The emergency reverse ADS ratio adjustment was forced by a formal non-compliance notice from Nasdaq after the stock failed to maintain the $1.00 minimum bid requirement, leaving the company exposed to delisting risks if post-split price levels are not sustained.
- Aggressive Shareholder Dilution: The company recently completed a $4.375 million registered direct offering at a steep discount ($0.625 per ADS), expanding total shares outstanding by nearly 49% over the past year and severely diluting existing equity holders.
- Severe Revenue Contraction and Cash Burn: Annual top-line performance deteriorated sharply with revenues falling 40.5% year-over-year to $25.10 million while net losses expanded 148% to $32.50 million, producing deeply negative operating margins (-129.9%) and unsustainable free cash flow deficits.
This article may include AI-generated content that is human-reviewed, which is for reference and general information purposes only and does not constitute investment advice.
Recommended Articles









Comments (0)
Click the $ button, enter the symbol, and select to link a stock, ETF, or other ticker.