


Futu Holdings Ltd Stock (FUTU) Moved Up by 7.87% on Aug 25: Drivers Behind the Movement



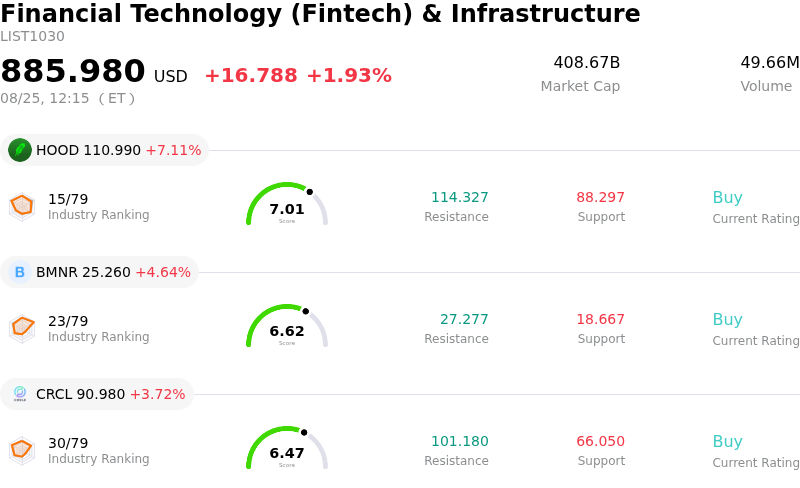
Futu Holdings Ltd (FUTU) moved up by 7.87%. The Financial Technology (Fintech) & Infrastructure sector is up by 1.93%. The company outperformed the industry. Top 3 stocks by turnover in the sector: Robinhood Markets Inc (HOOD) up 7.11%; BitMine Immersion Technologies Ord Shs (BMNR) up 4.64%; Circle Internet Group Inc (CRCL) up 3.72%.
What is driving Futu Holdings Ltd (FUTU)’s stock price up today?
Futu Holdings experienced strong buying pressure driven by sustained positive sentiment following its robust second-quarter earnings beat and operational resilience. The online brokerage reported strong top-line and bottom-line growth, comfortably surpassing analyst expectations. The surge in performance was propelled by record total trading volumes, heightened retail investor activity across key equities markets, and solid expansion in international markets, particularly across Southeast Asia and Japan. Furthermore, management's reassurances during the earnings call indicating that the bulk of regulatory-driven asset outflows had already been absorbed provided significant confidence to institutional investors regarding the company's long-term growth trajectory.
Market participants also responded positively to the passing of a key legal milestone on August 25, which marked the final court deadline for lead plaintiff filings related to previously disclosed regulatory class actions. The arrival of this deadline helped lift a lingering calendar uncertainty, encouraging market participants to refocus on the company's underlying fundamentals, ongoing share repurchases, and operational execution. The resolution of near-term legal noise catalyzed additional institutional interest, particularly as valuation metrics remained favorable relative to historical earnings multiples.
Intraday trading dynamics reflected heightened volatility as dip-buying emerged following brief consolidation earlier in the week. Short covering combined with strong retail momentum and technical support near key moving averages pushed trading volume higher. As investor focus shifted back to robust margin financing balances, user account growth, and expanding profitability margins, the stock attracted aggressive inflows from momentum traders seeking exposure to the broader Asia-Pacific fintech recovery.
Technical Analysis of Futu Holdings Ltd (FUTU)
Technically, Futu Holdings Ltd (FUTU) shows a MACD (12,26,9) value of 3.209, indicating a buy signal. The RSI at 67.054 suggests neutral condition and the Williams %R at 0.046 suggests overbought condition. Please monitor closely.
Fundamental Analysis of Futu Holdings Ltd (FUTU)
Futu Holdings Ltd (FUTU) is in the Financial Technology (Fintech) & Infrastructure industry. Its latest annual revenue is $2.77B, ranking 11 in the industry. The net profit is $1.45B, ranking 4 in the industry. Company Profile
Over the past month, multiple analysts have rated the company as Buy, with an average price target of $170.74, a high of $233.00, and a low of $127.10.
More details about Futu Holdings Ltd (FUTU)
Company Specific Risks:
- Securities Class Action Deadline and Regulatory Penalties: The arrival of the August 25, 2026 lead-plaintiff deadline for securities fraud class action lawsuits has heightened litigation risk. The legal actions stem from allegations that Futu failed to disclose unauthorized cross-border trading operations in Mainland China prior to a proposed RMB 1.85 billion ($271 million) CSRC regulatory penalty and personal fines on CEO Li Hua.
- Management Guidance on Softer Q3 Trading Momentum: Following the Q2 2026 financial release, management cautioned during analyst discussions that Q3 trading activity is decelerating amid broader market volatility and structural headwinds. Ongoing restrictions forcing Mainland Chinese client accounts into a sell-only and withdraw-only status continue to trigger asset outflows and constrain trading volume velocity.
- Deteriorating Blended Commission Rates: A widening structural divergence between user trading volume and fee monetization is pressuring brokerage revenue growth. While total Q2 trading volume jumped 78.8% year-over-year to HK$6.42 trillion, brokerage commission income grew by just 30.3% due to a declining blended commission rate as client flow shifts heavily toward lower-monetization U.S. equities and capped-fee options.
- Surging AI Infrastructure and Servicing Costs: Operational gross margins are encountering cost inflation as processing and servicing expenses surged 69.6% year-over-year to HK$225.0 million. The sharp expense growth outpaced revenue gains, driven by escalating cloud service fees required to power the platform's AI capabilities.
This article may include AI-generated content that is human-reviewed, which is for reference and general information purposes only and does not constitute investment advice.
Recommended Articles









Comments (0)
Click the $ button, enter the symbol, and select to link a stock, ETF, or other ticker.