


DICK'S Sporting Goods Inc Stock (DKS) Moved Down by 25.48% on Aug 25: Drivers Behind the Movement



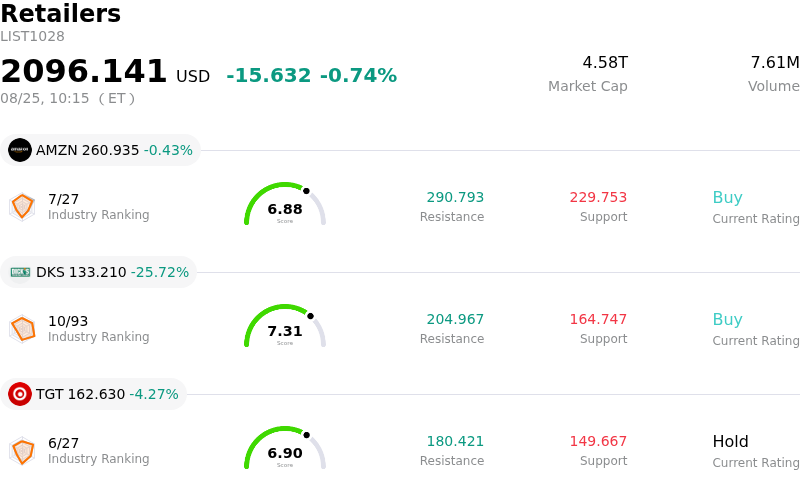
DICK'S Sporting Goods Inc (DKS) moved down by 25.48%. The Retailers sector is down by 0.74%. The company underperformed the industry. Top 3 stocks by turnover in the sector: Amazon.com Inc (AMZN) down 0.41%; DICK'S Sporting Goods Inc (DKS) down 25.72%; Target Corp (TGT) down 4.27%.
What is driving DICK'S Sporting Goods Inc (DKS)’s stock price down today?
Dick's Sporting Goods experienced a sharp sell-off following the release of its second-quarter financial results, which missed Wall Street expectations on both top and bottom lines. Investor sentiment was further impaired by management's decision to significantly reduce its full-year guidance for net sales, operating income, and earnings per share. The outlook revision reflects growing caution around consumer discretionary spending and an increasingly promotional retail landscape across athletic footwear and apparel.
The primary catalyst behind the financial shortfall stems from operational pressure within the newly acquired Foot Locker business. The Foot Locker segment generated a pro forma comparable-sales decline and recorded an operating loss during the quarter. Management highlighted a challenging athletic footwear market characterized by heightened discounting, fewer high-profile shoe launches, and softer demand for legacy footwear silhouettes. Furthermore, integration charges and share dilution associated with the transaction continue to compress consolidated operating margins.
Despite the headwinds at Foot Locker, the core Dick's Sporting Goods banner demonstrated relative resilience, delivering solid comparable-sales growth supported by market share gains and key promotional drivers. However, market participants remain focused on near-term integration hurdles and the lower operational profit trajectory. Following the quarterly report, several research analysts lowered their price targets on the stock to reflect a costlier and extended turnaround timeline for the footwear unit.
Technical Analysis of DICK'S Sporting Goods Inc (DKS)
Technically, DICK'S Sporting Goods Inc (DKS) shows a MACD (12,26,9) value of -9.729, indicating a sell signal. The RSI at 16.743 suggests oversold condition and the Williams %R at 99.627 suggests oversold condition. Please monitor closely.
Fundamental Analysis of DICK'S Sporting Goods Inc (DKS)
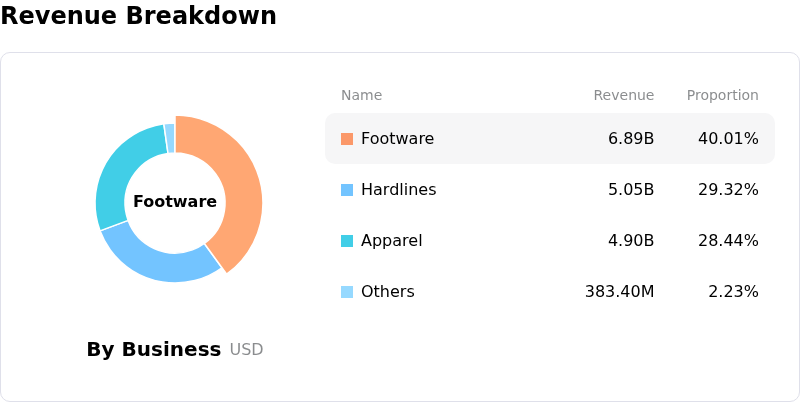
DICK'S Sporting Goods Inc (DKS) is in the Retailers industry. Its latest annual revenue is $17.22B, ranking 14 in the industry. The net profit is $849.24M, ranking 13 in the industry. Company Profile
Over the past month, multiple analysts have rated the company as Buy, with an average price target of $249.46, a high of $300.00, and a low of $169.00.
More details about DICK'S Sporting Goods Inc (DKS)
Company Specific Risks:
- Foot Locker Segment Operating Losses and Integration Drag: The newly acquired Foot Locker business posted a pro forma comparable-sales decline of 3.6% and an operating loss of $31.9 million for fiscal Q2 2026, creating a severe operational drag alongside significant share dilution and ongoing integration cost burdens.
- Drastic Full-Year Earnings and Revenue Guidance Cuts: Management slashed full-year 2026 GAAP EPS guidance to $10.94–$11.94 (down from $13.27–$14.27), missing market expectations by a wide margin as executive leadership adopted a significantly more cautious outlook on second-half consumer demand.
- Promotional Pricing Pressure and Margin Compression: Intensifying promotional activity across athletic footwear and apparel, compounded by underperforming product launches, pressured gross margins down by 228 basis points and contracted consolidated operating margin from 12.4% to 7.9%.
- Substantial Inventory Expansion and Balance Sheet Exposure: Total inventory surged 63% year-over-year to $5.57 billion while long-term debt rose to $1.91 billion and cash balances dropped to $913.7 million, heightening working capital risk during a promotional retail environment.
This article may include AI-generated content that is human-reviewed, which is for reference and general information purposes only and does not constitute investment advice.
Recommended Articles









Comments (0)
Click the $ button, enter the symbol, and select to link a stock, ETF, or other ticker.