


XRP (XRPUSD) Is down 2.42% on Aug 24: What Do On-Chain Data and Market Sentiment Show?



XRP (XRPUSD) is down 2.42% at Aug 24 00:00(ET), now at $1.4646, with a 7-day up of 45.95%.
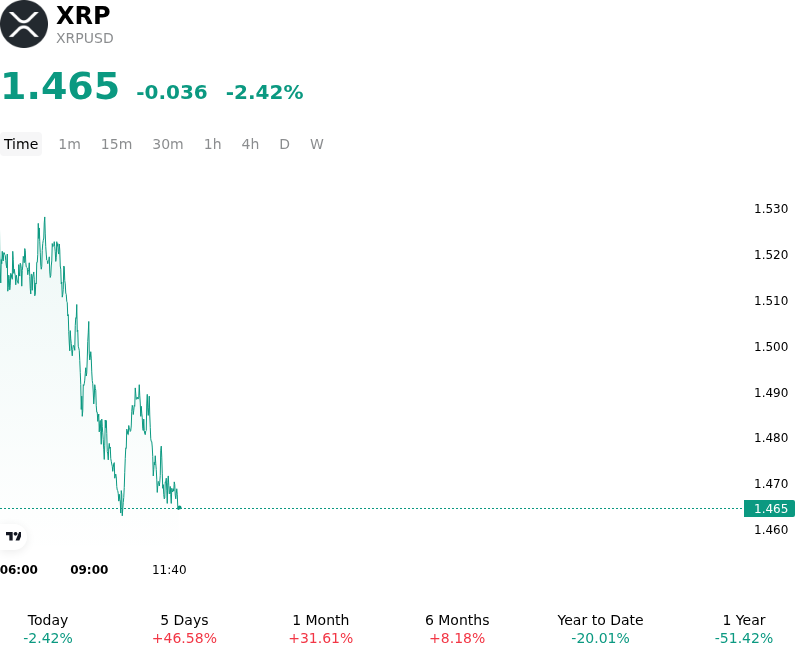
What is driving XRP (XRPUSD)’s stock price down today?
The intraday decline in XRP reflects a wave of technical profit taking and leverage unwinding following a rapid multi-day extension into major overhead resistance. After a significant rally propelled by broader digital asset momentum and macroeconomic liquidity repricing, buying momentum stalled as prices encountered heavy structural supply near multi-month resistance levels. As major benchmark digital assets paused their upward momentum, risk appetite across altcoins cooled, prompting traders and institutional funds to lock in gains.
Derivatives positioning played a central role in accelerating the downside move. The prior rapid surge had elevated perpetual futures funding rates and crowded long speculative positions. When spot buying volume failed to absorb overhead selling pressure, the initial reversal triggered a cascade of long liquidations and stop-loss executions. This liquidity sweep forced overleveraged market participants to exit, amplifying short-term selling pressure and driving prices lower into nearby technical support zones.
Despite the immediate market correction, broader institutional and structural drivers remain closely monitored. Recent strength in investment product inflows, alongside expanding on-chain stablecoin transfer volumes and ledger activity, continues to improve long-term ecosystem fundamentals. However, market participants are exercising caution ahead of key macroeconomic events and regulatory updates, particularly surrounding pending U.S. digital asset market structure legislation. In the near term, the pullback represents an event-driven leverage wash and tactical consolidation following an overextended move, rather than a fundamental shift in market structure.
Technical Analysis of XRP (XRPUSD)
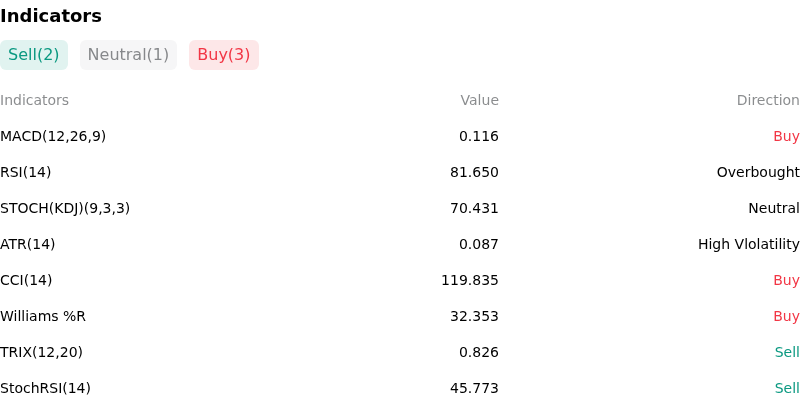
Technically, XRP (XRPUSD) shows a MACD (12,26,9) value of 0.116, indicating a buy signal. The RSI at 81.650 suggests overbought condition and the Williams %R at 32.353 suggests buy condition. Please monitor closely.
More details about XRP (XRPUSD)
Recent Events and Risks:
- Massive Derivatives Long Liquidations: A sharp market deleveraging event triggered a sudden flash crash in XRP, forcing the liquidation of roughly $500 million in leveraged long positions on major venues such as Binance, leaving open interest vulnerable to cascading margin calls if support breaks.
- Legislative Bottlenecks Surrounding the CLARITY Act: Despite recent White House discussions and political momentum, the CLARITY Act remains stalled in the U.S. Senate, creating downside risk if procedural delays undermine market expectations or if traders sell off upon realizing the bill benefits Ripple as a corporate entity more directly than the XRP token itself.
- Technical Exhaustion and Overbought Reversal: Following a rapid multi-day surge of over 50% that pushed XRP's 14-day Relative Strength Index (RSI) into extreme overbought territory above 90, failure to reclaim key resistance around $1.53 to $1.65 leaves price vulnerable to an extended pullback toward lower moving average supports.
- Retail-Dominant Market Structure Vulnerability: Market data highlights that XRP retains a heavily concentrated retail investor base of roughly 84%, making intraday liquidity fragile and prone to panic-driven sell-offs during broader market risk-off shifts, while XRPL base fee burns remain negligible.
This article may include AI-generated content that is human-reviewed, which is for reference and general information purposes only and does not constitute investment advice.
Recommended Articles









Comments (0)
Click the $ button, enter the symbol, and select to link a stock, ETF, or other ticker.