


Wheat Futures (WHEAT-F) Is up 2.02% on Aug 23: What Changed in Supply and Demand?



Wheat Futures (WHEAT-F) is up 2.02% at Aug 23 22:25(ET), now at $694.7, with a 7-day up of 3.12%.
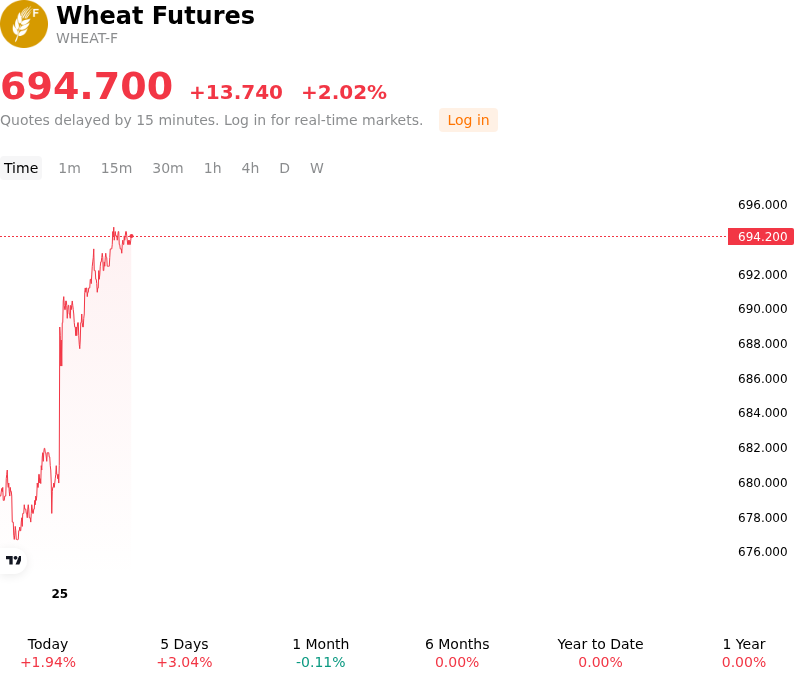
What is driving Wheat Futures (WHEAT-F)’s stock price up today?
Wheat futures advanced as persistent geopolitical risks and logistical bottlenecks across the Black Sea basin threatened global export availability. Renewed disruptions to key port infrastructure, alongside elevated freight and insurance costs, hampered grain transport out of major export channels, increasing the likelihood that international buyers will be forced to pivot toward North American and Southern Hemisphere suppliers. This supply-side repricing was further supported by recent downgrades to global production forecasts by agricultural agencies, reflecting reduced yield expectations in major producing nations such as Russia and tightening overall global wheat balance sheets.
Weather-related developments added a further risk premium to forward pricing. Severe moisture deficits and persistent dry conditions across the U.S. Southern Plains and parts of Europe raised early concerns regarding field conditions ahead of winter crop planting. At the same time, spillover strength from the broader agricultural complex bolstered sentiment, as downward yield revisions for corn and feed grains heightened expectations for substitution demand and overall tightness in global grain balances.
From a positioning perspective, the rally was reinforced by institutional capital flows and short-covering activity. Managed money accounts moved to cover net-short exposure in Chicago and Kansas City futures in response to escalating geopolitical uncertainty and tightening near-term export flows. While seasonal harvest supply continues to cap explosive upside in the immediate spot market, investors continue to monitor Black Sea export logistics, winter wheat planting progress, and global import tender demand as key indicators for structural market balance.
Technical Analysis of Wheat Futures (WHEAT-F)
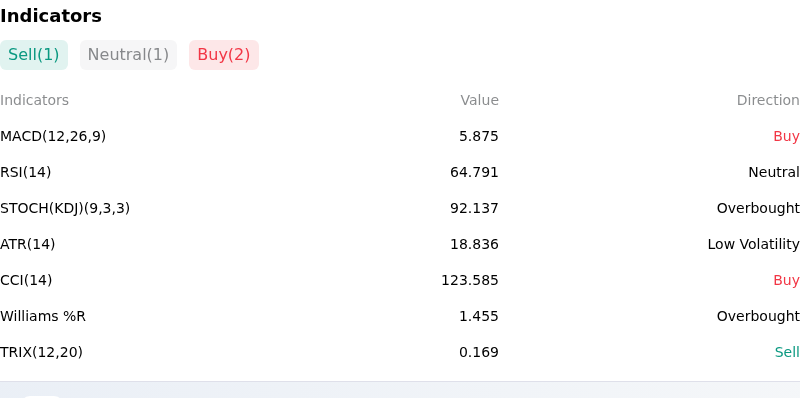
Technically, Wheat Futures (WHEAT-F) shows a MACD (12,26,9) value of 5.875, indicating a buy signal. The RSI at 64.791 suggests neutral condition and the Williams %R at 1.455 suggests overbought condition. Please monitor closely.
More details about Wheat Futures (WHEAT-F)
Recent Events and Risks:
- Sluggish Export Demand and Lagging U.S. Sales Pace: The latest USDA export figures indicate 2026/27 U.S. wheat commitments are trailing 31% below last year's pace, completing just 38% of projected full-year exports versus the 49% historical average. This sluggish international demand creates downside price pressure as major global importers defer purchases or seek alternative origins.
- Northern Hemisphere Seasonal Harvest Influx: The ongoing U.S. harvest alongside promising spring wheat collections in Canada is increasing physical spot grain availability in primary market channels. This seasonal influx of physical supply generates commercial producer hedging, capping intraday upside and weighing on futures across Chicago, Kansas City, and Minneapolis exchanges.
- Aggressive Competition from Black Sea Export Volumes: Despite lingering regional logistics friction, Russian wheat production forecasts remain elevated at 88.2 million metric tons, keeping low-priced Black Sea origin grain flowing into world markets. The large volume of discounted Black Sea supply limits export competitiveness for U.S. soft red and hard red winter wheat, suppressing global benchmark prices.
- Technical Resistance Rejections and Expiry Pressure: Wheat futures failed to maintain momentum above key technical resistance near $6.80 per bushel, triggering long liquidation and profit-taking across nearby contracts. Near-term options expiration and speculative positioning adjustments are compounding intraday downside volatility.
This article may include AI-generated content that is human-reviewed, which is for reference and general information purposes only and does not constitute investment advice.
Recommended Articles









Comments (0)
Click the $ button, enter the symbol, and select to link a stock, ETF, or other ticker.