


BNB (BNBUSD) Volatility Intensified on Aug 23: What You Should Know



BNB (BNBUSD) is down 1.42% at Aug 23 00:05(ET), now at $685.9, with a 7-day up of 13.63%.
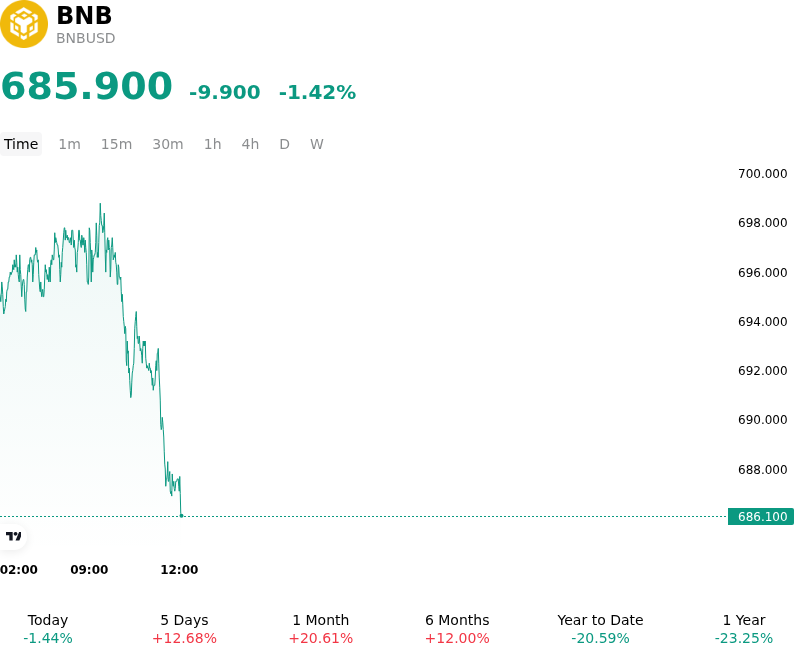
What is driving BNB (BNBUSD)’s stock price down today?
The downward pressure on BNB during the trading session was primarily driven by technical profit-taking and long position liquidations following a strong multi-day rally into major overhead resistance. Momentum metrics had shifted into overbought territory after repeated tests of technical ceilings, prompting short-term traders to de-risk and secure gains. This pullback coincided with a noticeable contraction in derivatives open interest, indicating that the retreat was largely driven by structural deleveraging rather than aggressive new short-side accumulation.
Macroeconomic liquidity conditions provided limited offset, as stabilizing US Treasury yields and a temporary pause in broader digital asset momentum encouraged a risk-neutral posture among institutional market participants. While fundamental catalysts—including ongoing chain upgrades, automated token burns, and institutional smart-contract basket allocations—maintain a solid structural floor for the token, spot buying volume moderated across major venues. The temporary drop in spot order book depth exacerbated price sensitivity to moderate sell orders.
Furthermore, periodic risk and liquidity reviews by centralized trading platforms, leading to minor adjustments in leveraged margin pairs, temporarily reduced trading velocity for associated quote assets. Looking forward, institutional investors continue to monitor systemic leverage across perpetual swap markets and incoming Federal Reserve policy signals for broader macro directional cues. Market participants view the current price action as a standard liquidity reset, with key focus centered on whether spot accumulation re-emerges around primary moving average support zones.
Technical Analysis of BNB (BNBUSD)
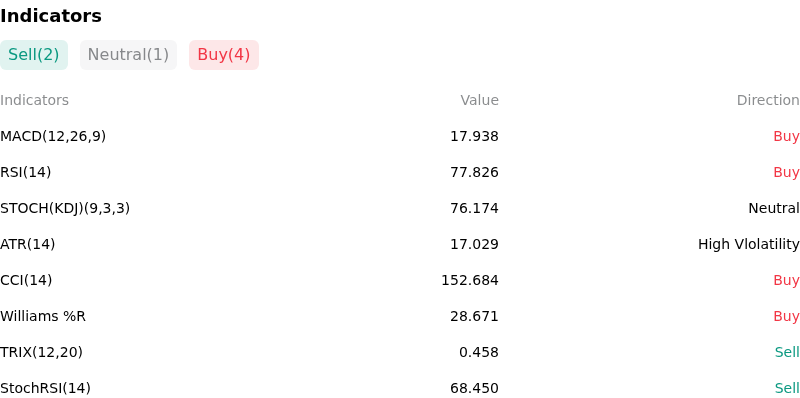
Technically, BNB (BNBUSD) shows a MACD (12,26,9) value of 17.951, indicating a buy signal. The RSI at 77.883 suggests buy condition and the Williams %R at 28.594 suggests buy condition. Please monitor closely.
More details about BNB (BNBUSD)
Recent Events and Risks:
- Strict Binance Sanctions Screening and Transaction Blocks: Binance has finalized compliance actions halting transactions involving 16 designated crypto platforms—including HTX and EXMO—effective August 23. Increased counterparty screening tied to international sanctions enforcement creates mandatory compliance reviews, potential wallet holds, and deposit delays, generating operational friction and regulatory concern across the BNB ecosystem.
- Derivatives Leverage Reset and Liquidation Exposure: In the wake of multi-billion dollar futures squeezes and sharp leverage recalibration across major exchanges, open interest on Binance derivatives remains elevated. Sudden intraday market pullbacks pose significant risk of forced long liquidation cascades that could rapidly depress BNB pricing.
- Spot and Margin Trading Pair Delistings: Periodic liquidity and risk reviews on Binance led to the delisting of several spot and margin trading pairs, including BNB-quoted assets such as LTC/BNB and SUI/BNB, alongside the closure of selected USDC margin positions. The removal of these trading pairs thins order book depth and removes arbitrage paths, placing localized downward pressure on BNB-denominated pairs.
- Technical Resistance Overhead and Relative Weakness: BNB continues to face technical selling pressure near the $600–$605 resistance zone, underperforming other large-cap altcoins during recent broader market fluctuations. Failure to maintain footing above immediate trendline support near $597 elevates the risk of a breakdown toward secondary support levels around $585.
This article may include AI-generated content that is human-reviewed, which is for reference and general information purposes only and does not constitute investment advice.
Recommended Articles









Comments (0)
Click the $ button, enter the symbol, and select to link a stock, ETF, or other ticker.