


Eli Lilly and Co Stock (LLY) Moved Up by 5.18% on Aug 19: What Investors Need To Know



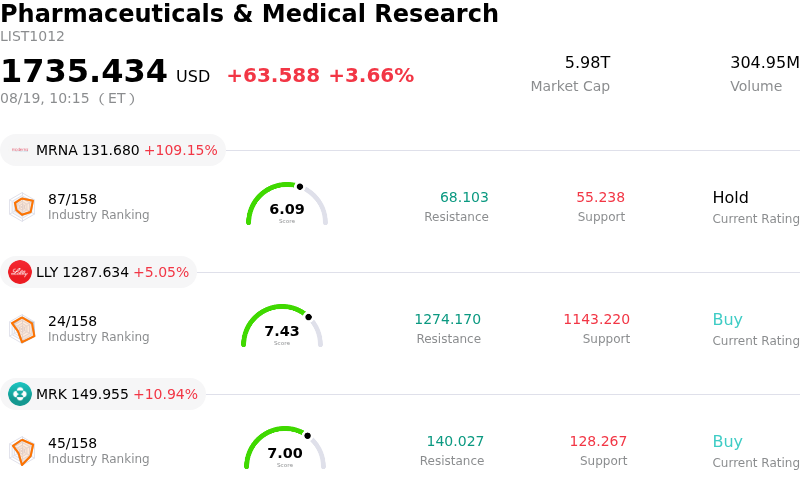
Eli Lilly and Co (LLY) moved up by 5.18%. The Pharmaceuticals & Medical Research sector is up by 3.66%. The company outperformed the industry. Top 3 stocks by turnover in the sector: Moderna Inc (MRNA) up 116.38%; Eli Lilly and Co (LLY) up 5.18%; Merck & Co Inc (MRK) up 10.94%.
What is driving Eli Lilly and Co (LLY)’s stock price up today?
Eli Lilly experienced strong upward momentum as institutional investors continued to price in the company's powerful fundamental trajectory following exceptional quarterly financial results and an upgraded full-year outlook. Revenue and adjusted earnings significantly outpaced Wall Street estimates, propelled by explosive volume growth in its flagship metabolic franchise, including Mounjaro for type 2 diabetes and Zepbound for weight management. Strong commercial execution in the United States, alongside expanding international reimbursement and market adoption, highlighted robust demand that continues to test manufacturing capacity. By raising its full-year top-line revenue guidance and expanding expected operating margins, management reaffirmed its operational leadership in the rapidly growing global metabolic and anti-obesity market.
Beyond current product performance, positive sentiment has been bolstered by significant pipeline developments and strategic business execution. Enthusiasm remains high for next-generation candidates, particularly retatrutide, which delivered positive late-stage clinical data across multiple obesity-related indications, paving the way for upcoming global regulatory filings. Meanwhile, international commercial achievements, including approvals and expanded coverage for weight-loss treatments, strengthen the company's multi-year growth runway. The company has also continued to execute strategic business development, forming strategic discovery collaborations and acquiring promising early-stage pipelines in central nervous system disorders and immunology, reinforcing its long-term research capabilities.
Market dynamics and broader equity rotations have further supported the upward trajectory. Amid valuation friction in high-flying technology sectors, institutional capital has increasingly rotated into defensive yet high-growth mega-cap healthcare names with highly visible earnings profiles. While ongoing net pricing compression in the United States and high revenue concentration in core therapeutic lines remain key operational considerations, sell-side analysts have responded with upward earnings revisions and target price increases. These fundamental catalysts, combined with favorable long-term intrinsic valuation models, continue to fuel strong investor demand and drive positive price action.
Technical Analysis of Eli Lilly and Co (LLY)
Technically, Eli Lilly and Co (LLY) shows a MACD (12,26,9) value of 3.326, indicating a buy signal. The RSI at 57.850 suggests neutral condition and the Williams %R at 10.974 suggests overbought condition. Please monitor closely.
Media Coverage of Eli Lilly and Co (LLY)
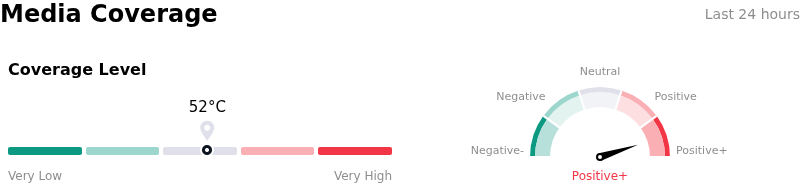
In terms of media coverage, Eli Lilly and Co (LLY) shows a coverage score of 52, indicating a moderate level of media attention. The overall market sentiment index is currently in extremely bullish zone.
Fundamental Analysis of Eli Lilly and Co (LLY)
Eli Lilly and Co (LLY) is in the Pharmaceuticals & Medical Research industry. Its latest annual revenue is $65.18B, ranking 4 in the industry. The net profit is $20.64B, ranking 2 in the industry. Company Profile
Over the past month, multiple analysts have rated the company as Buy, with an average price target of $1296.81, a high of $1600.00, and a low of $850.00.
More details about Eli Lilly and Co (LLY)
Company Specific Risks:
- U.S. Net Pricing Compression and Rebate Headwinds: Realized product prices in the United States face ongoing downward pressure, generating a low-to-mid teens percentage drag on top-line growth, while the non-recurrence of favorable first-half rebate and discount adjustments creates immediate downside risk for second-half sales comparisons.
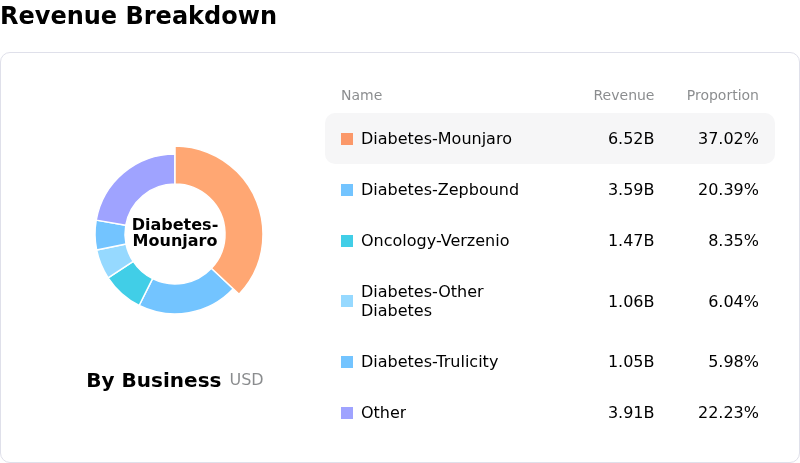
- Extreme Revenue Concentration in Tirzepatide Portfolio: Mounjaro and Zepbound account for roughly 65% of total corporate revenue, exposing the company's valuation to severe downward volatility in the event of supply bottlenecks, emerging side-effect profile concerns, or aggressive competitor pricing.
- Illicit Black-Market Proliferation and Legal Escalations: Widespread illegal compounding and black-market distribution of experimental pipeline candidates like retatrutide have forced the company into aggressive federal litigation, creating patient safety liability risks, regulatory friction, and brand erosion.
- Executive Stock Dispositions at Peak Valuations: SEC Form 4 disclosures show insider selling by senior leadership, including Executive Vice President Patrik Jonsson disposing of 6,500 shares worth $7.63 million, triggering cautious market sentiment around executive profit-taking near historical valuation highs.
This article may include AI-generated content that is human-reviewed, which is for reference and general information purposes only and does not constitute investment advice.
Recommended Articles









Comments (0)
Click the $ button, enter the symbol, and select to link a stock, ETF, or other ticker.