


Solana (SOLUSD) Is up 1.01% on Aug 19: Key Drivers to Watch



Solana (SOLUSD) is up 1.01% at Aug 19 08:35(ET), now at $76.66, with a 7-day up of 2.31%.
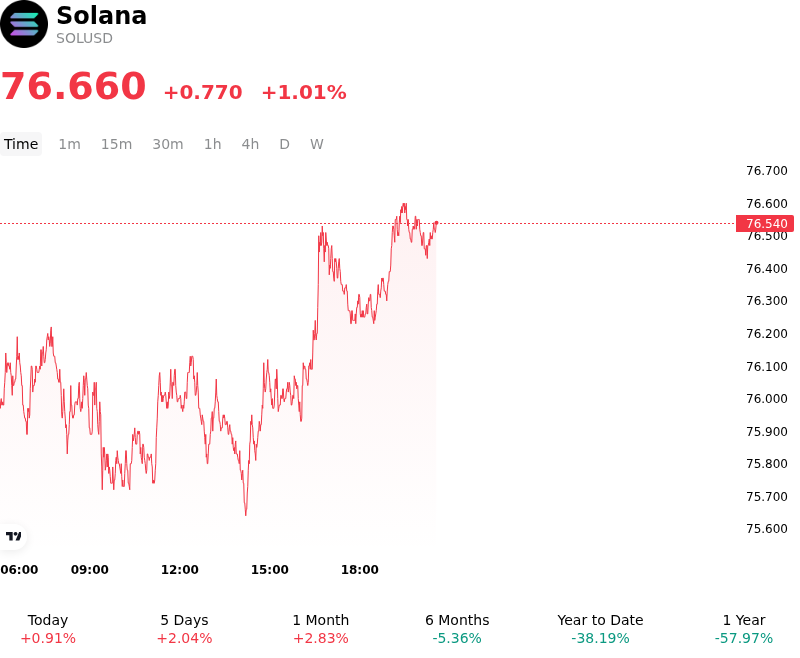
What is driving Solana (SOLUSD)’s stock price up today?
Capital inflows into Solana were led by renewed institutional allocation and high-conviction spot accumulation. Institutional participation was highlighted by asset managers expanding positions in Solana-focused staking exchange-traded fund vehicles, reflecting persistent demand for yield-generating digital assets. Concurrently, on-chain metrics revealed large-scale whale entities acquiring spot supply after extended periods of inactivity. This absorption of circulating tokens tightened immediate market depth and improved spot liquidity conditions across major venues.
Beyond immediate capital flows, market sentiment benefited from sustained ecosystem expansion and protocol fundamentals. The steady growth of tokenized real-world assets on the network, paired with ongoing progress toward protocol performance upgrades designed to minimize finality latency, strengthened long-term adoption expectations among institutional investors. High network staking participation rates further constrained circulating supply, reinforcing structural price support and absorbing potential liquidations.
From a positioning perspective, the intraday stabilization triggered short-term systematic buying and derivatives repricing. The convergence of key moving averages near established support zones prompted long positioning among top market participants on major derivatives exchanges. While broader digital asset sentiment remains sensitive to global macroeconomic liquidity and interest rate expectations, Solana's price action demonstrates a fundamental re-accumulation phase supported by institutional flow and tightening supply dynamics.
Technical Analysis of Solana (SOLUSD)
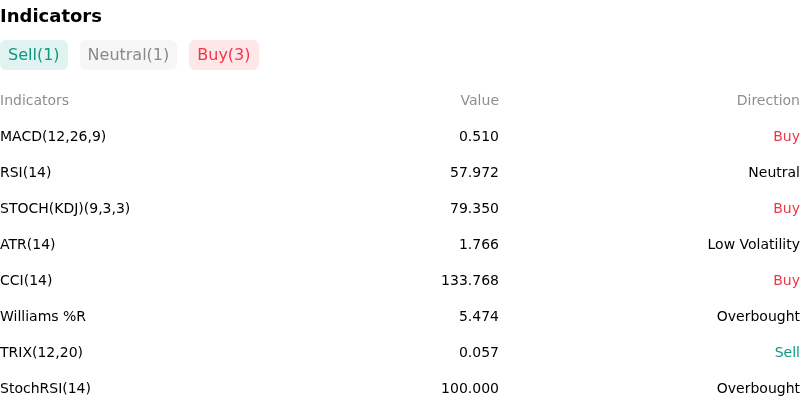
Technically, Solana (SOLUSD) shows a MACD (12,26,9) value of 0.510, indicating a buy signal. The RSI at 57.972 suggests neutral condition and the Williams %R at 5.474 suggests overbought condition. Please monitor closely.
More details about Solana (SOLUSD)
Recent Events and Risks:
- Asymmetric Derivatives Long Bias and Liquidation Vulnerability: Futures trading volume across major exchanges has spiked while trader positioning remains heavily skewed toward longs, creating acute exposure to rapid sell-offs and forced liquidation cascades if SOL fails to hold immediate support near $75.00.
- Key Overhead Resistance and Technical Breakdown Risk: SOL continues to struggle below critical technical barriers between $78.00 and $80.00, including its 50-day EMA and daily Ichimoku cloud, maintaining a bearish structural posture that threatens a breakdown toward lower support floors at $70.00 and $68.00.
- Softening Ecosystem Fundamentals and Reduced On-Chain Volume: Decentralized exchange (DEX) trading volumes and total value locked (TVL) across Solana applications have experienced notable contractions, weakening the underlying spot market demand required to absorb persistent sell pressure.
- Macro Yield Pressures and Risk-Off Asset Reallocation: Restrictive Federal Reserve monetary policy, persistent high U.S. Treasury yields, and escalating global geopolitical uncertainties continue to suppress broader appetite for high-beta cryptocurrencies, driving capital reallocation away from altcoins.
This article may include AI-generated content that is human-reviewed, which is for reference and general information purposes only and does not constitute investment advice.
Recommended Articles









Comments (0)
Click the $ button, enter the symbol, and select to link a stock, ETF, or other ticker.