


Ge Vernova Inc Stock (GEV) Moved Up by 3.23% on Aug 17: Key Drivers Unveiled



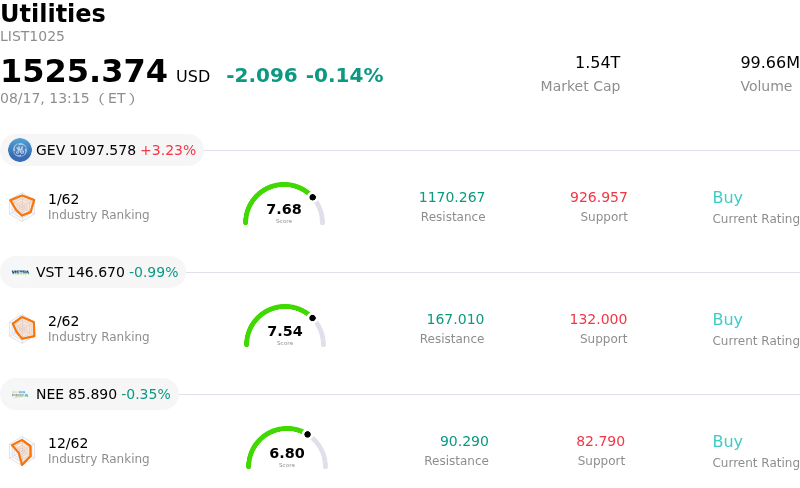
Ge Vernova Inc (GEV) moved up by 3.23%. The Utilities sector is down by 0.14%. The company outperformed the industry. Top 3 stocks by turnover in the sector: Ge Vernova Inc (GEV) up 3.23%; Vistra Corp (VST) down 0.99%; Nextera Energy Inc (NEE) down 0.35%.
What is driving Ge Vernova Inc (GEV)’s stock price up today?
GE Vernova experienced upward price movement amidst heightened intraday volatility, driven primarily by persistent structural tailwinds surrounding global power infrastructure demand. As artificial intelligence data centers, industrial electrification, and grid modernization projects proliferate, hyperscalers and utility companies are rapidly expanding their electricity generation and transmission capacity. GE Vernova continues to serve as a primary beneficiary of this trend, with its order backlog reaching historic levels due to robust demand across its Power and Electrification divisions.
Investor sentiment remains anchored by recent operational momentum and management raising its full-year financial guidance for revenue and free cash flow. Substantial multi-year demand visibility in gas equipment slot reservations and data center contracts has helped reassure the market, helping to absorb operational headwinds in the wind segment. Additionally, strategic supply chain initiatives, including the expansion of high-voltage transmission equipment manufacturing in Pennsylvania and collaborative nuclear energy project developments, have strengthened the company's long-term market positioning.
Recent institutional disclosures showing increased equity stakes by several large asset managers have provided additional momentum. However, the stock's pronounced intraday volatility highlights a continuing debate among market participants regarding valuation and short-term execution risks following a powerful multi-month rally. While analysts broadly maintain a positive outlook based on long-term earnings trajectory and robust backlog execution, elevated market expectations continue to invite active trading and sharp intraday fluctuations.
Technical Analysis of Ge Vernova Inc (GEV)
Technically, Ge Vernova Inc (GEV) shows a MACD (12,26,9) value of 17.250, indicating a neutral signal. The RSI at 56.595 suggests neutral condition and the Williams %R at 4.178 suggests overbought condition. Please monitor closely.
Media Coverage of Ge Vernova Inc (GEV)
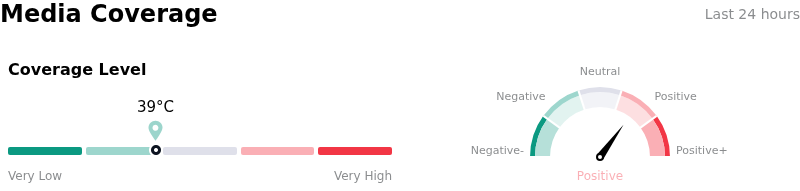
In terms of media coverage, Ge Vernova Inc (GEV) shows a coverage score of 39, indicating a low level of media attention. The overall market sentiment index is currently in bullish zone.
Fundamental Analysis of Ge Vernova Inc (GEV)
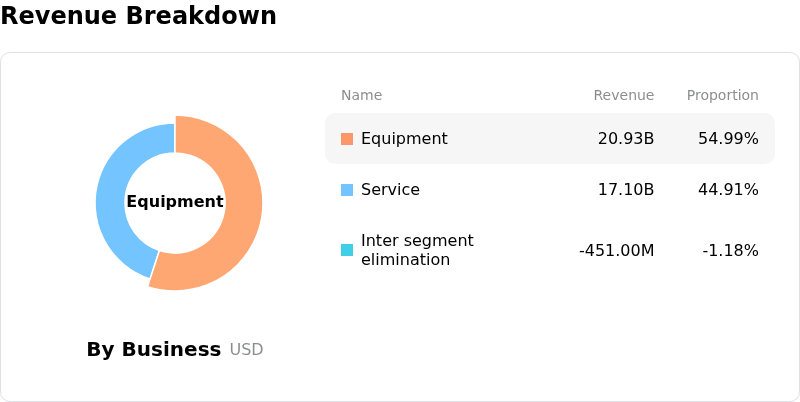
Ge Vernova Inc (GEV) is in the Utilities industry. Its latest annual revenue is $38.07B, ranking 2 in the industry. The net profit is $4.88B, ranking 4 in the industry. Company Profile
Over the past month, multiple analysts have rated the company as Buy, with an average price target of $1218.98, a high of $1450.00, and a low of $836.00.
More details about Ge Vernova Inc (GEV)
Company Specific Risks:
- Bottom-Line Earnings Miss and Margin Compression: Recent financial disclosures revealed a substantial second-quarter earnings per share miss ($2.47 actual vs. ~$3.13-$3.19 analyst consensus), triggering institutional concerns over bottom-line profit conversion despite top-line revenue growth.
- Persistent Operational Losses in Wind Segment: The company's Wind business remains a major operational drag, with management forecasting a segment EBITDA loss of approximately $400 million for 2026 due to sluggish onshore demand, elevated capital expenses, and regulatory permitting delays.
- Tariff Cost Inflation and Supply Constraints: Management projects a direct net tariff headwind of $250 million to $350 million across full-year 2026, alongside persistent global supply chain bottlenecks and logistical delays that threaten production timelines.
- Elevated Valuation Premium and Capacity Bottlenecks: Trading at a premium valuation near 40x forward earnings, GEV leaves zero margin for execution errors as manufacturing capacity limits (capped near 20 GW annually for gas power) constrain its ability to rapidly convert its $176 billion backlog into realized revenue.
This article may include AI-generated content that is human-reviewed, which is for reference and general information purposes only and does not constitute investment advice.
Recommended Articles









Comments (0)
Click the $ button, enter the symbol, and select to link a stock, ETF, or other ticker.